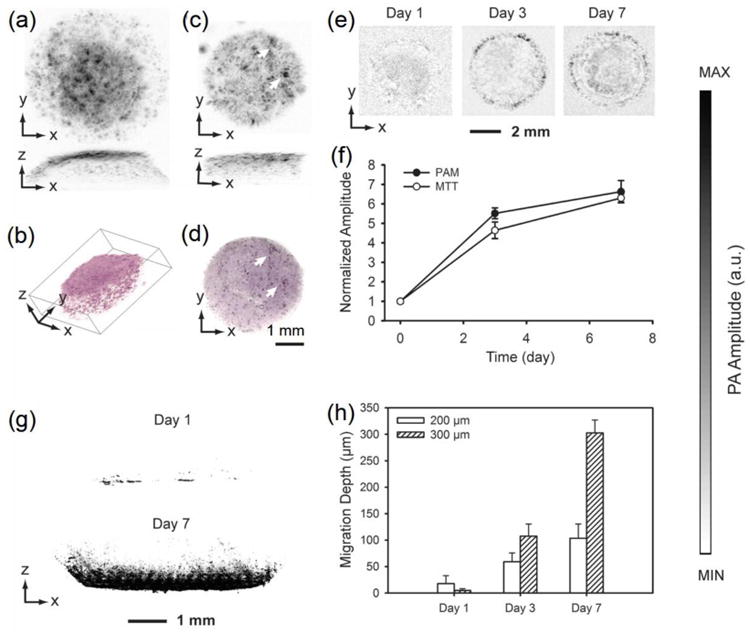
Figure 4.

(a) PAM MAP image of fibroblasts cultured in an inverse opal scaffold, followed by MTT staining; (b) 3D rendering of the volumetric PAM data in (a). (c) PAM MAP image of fibroblasts cultured in an inverse opal scaffold filled with cross-linked alginate hydrogel, followed by incubation with MTT; (d) an optical micrograph showing the same scaffold as in (c). The arrows indicate the matching features in PAM and optical microscopy. (e) PAM chronological images of fibroblasts grown in inverse opal scaffolds at 6 h, 3 days, and 7 days; (f) quantification of cell numbers in the scaffolds as determined by volumetric PAM data and parallel MTT biochemical assays. (g) PAM sagittal MAP images showing cell invasion profiles at Days 1 and 7 into inverse opal scaffolds with a pore size of 300 μm; (h) quantification of average cell penetration depths in scaffolds with pore sizes of 200 and 300 μm, respectively, as determined by PAM virtual biopsy. Adapted with permission from Ref.56, copyright 2011 Wiley-VCH.
