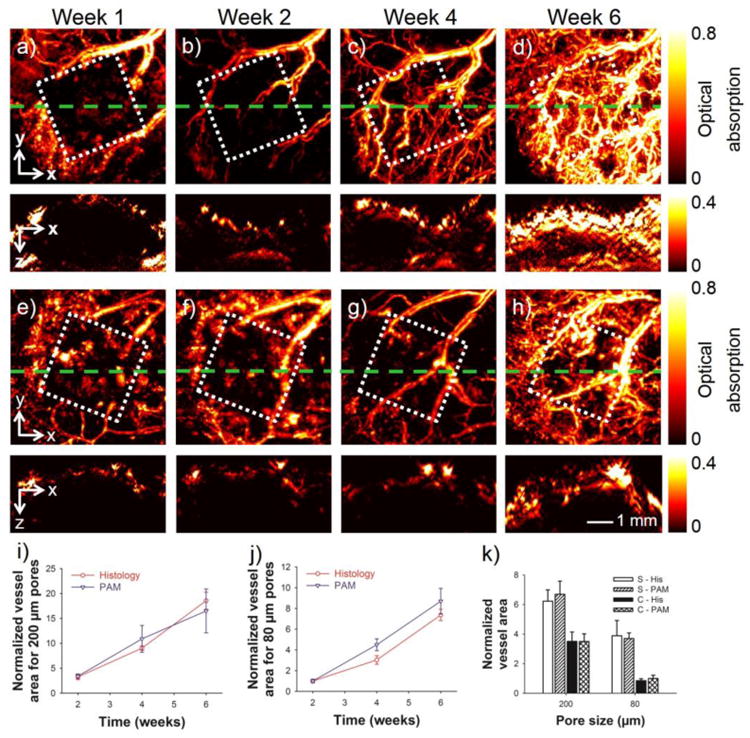
Figure 7.

(a–d) Top panel: MAP images showing the remodeling of neovasculature in a scaffold with a pore size of 200 μm at 1, 2, 4, and 6 weeks post implantation in a mouse ear model. Bottom panel: the corresponding cross-sectional images at planes marked by the green dashed lines. (e–h) Top panel: MAP images showing the remodeling of neovasculature in a scaffold with a pore size of 80 μm at 1, 2, 4, and 6 weeks post-implantation. Bottom panel: the corresponding cross-sectional images at planes marked by the green dashed lines. The square indicates the area where the scaffold resided. (i, j) Normalized blood vessel area calculated from both PAM data and histology for scaffolds with pore sizes of 200 μm and 80 μm, respectively. (k) Comparison of the blood vessel area in the scaffolds at planes close to the surface and in the central region of the scaffolds at 6 weeks post implantation. S: surface; C: center; His: histology. In (i–k) the area of blood vessels at each time point was normalized against that of the scaffold with a pore size of 80 μm at week 2. Reprinted with permission from Ref.72, copyright 2011 Mary Ann Liebert, Inc.
