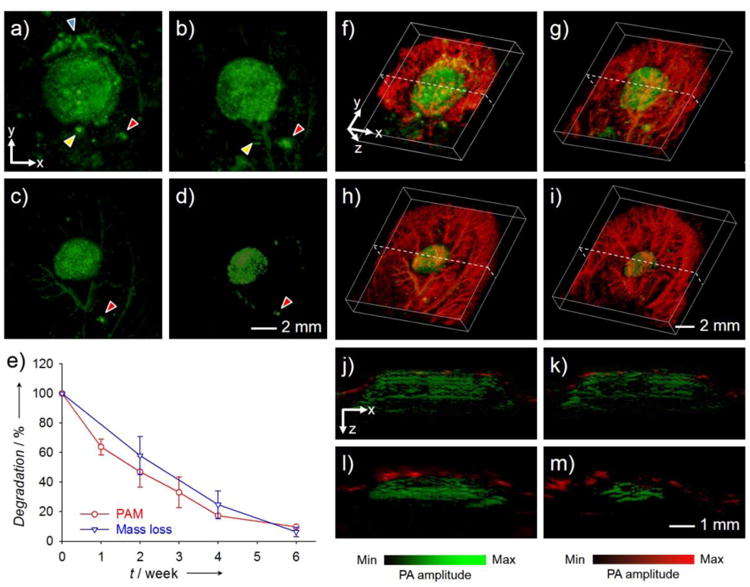
Figure 8.

(a–d) AR-PAM coronal MAP images taken from the same PLGA inverse opal scaffold implanted in the ear of a nude mouse at weeks 0, 1, 3, and 6 post implantation, respectively. The arrowheads indicate small pieces of the scaffold that likely came off during the surgery, and their slight changes in position and orientation relative to the main scaffold at different time points could be attributed to the activity of the mouse. (e) Comparison of the degradation profiles of scaffolds as a function of time obtained from the same scaffold using PAM and from different scaffolds using the conventional invasive mass loss assay. (f–i) Co-registered 3D reconstruction images showing both the degradation of the same scaffold and the remodeling of vasculature simultaneously. (j–m) Co-registered B-scan images at the dotted planes as indicated in (f–i), respectively. Reprinted with permission from Ref.77, copyright 2014 Wiley-VCH.
