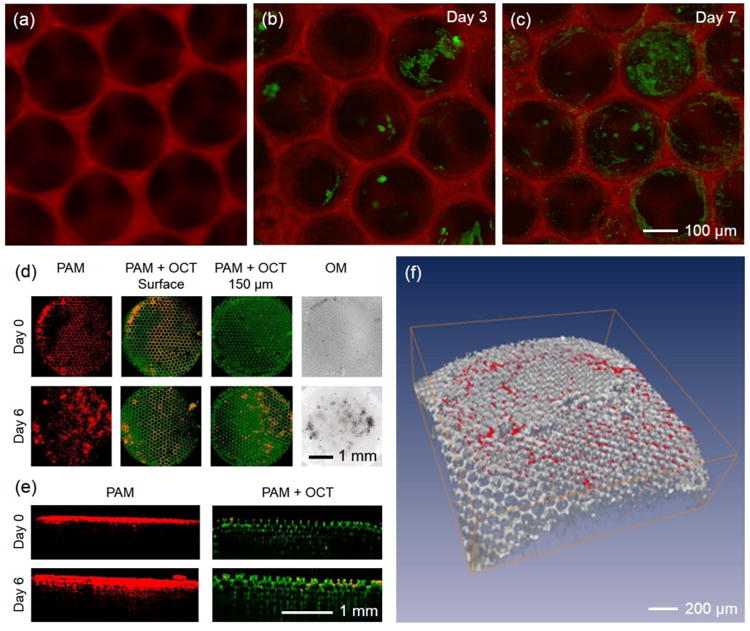
Figure 9.

(a) FCM imaging of a fluorescently labeled PLGA inverse opal scaffold using an OR-PAM-FCM hybrid system. (b, c) OR-PAM-FCM monitoring of melanoma cells grown on the scaffold, where the cells and scaffold were imaged using the PAM and FCM subsystems, respectively. OR-PAM-OCT images of melanoma cells cultured on an individual PLGA inverse opal scaffold for up to 6 days. (d, e) Coronal and sagittal views of the PAM and PAM/OCT images showing the ingrowth of melanoma cells from the surface into the center of the scaffold using the OR-PAM-OCT hybrid system. The melanoma cells were imaged by the PAM subsystem whereas the scaffold by the OCT subsystem in a label-free manner. (f) Volumetric rendering of the OCT-imaged scaffold (gray) with PAM-detected melanoma cells (red).
