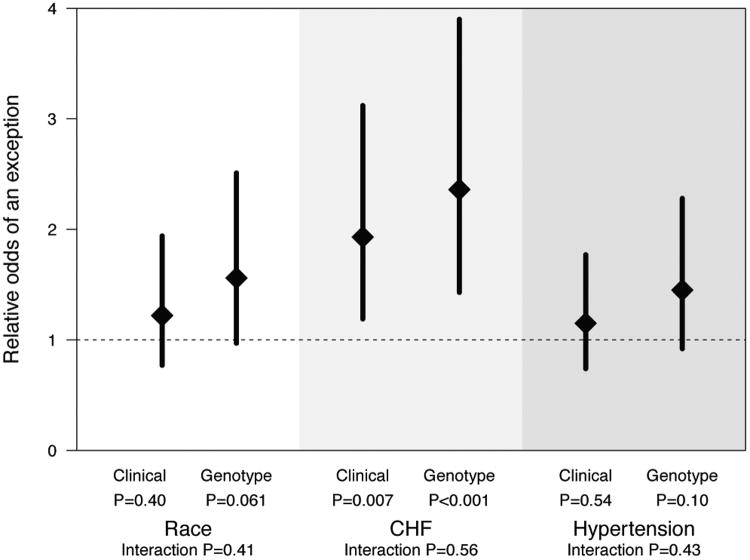
Figure.
Relative odds of an exception stratified by intervention (ie, clinically guided or pharmacogenetic-guided initiation). Diamonds represent estimated odds ratios comparing the odds of an exception between groups (eg, African American vs non-African American race), estimated from multivariable logistic regression models with group-by-intervention interaction terms and adjusted for age, sex, and clinical center. Models for congestive heart failure (CHF) and hypertension additionally adjusted for race. Error bars represent 95% confidence intervals. P values evaluate whether odds ratios are equal to 1. Interaction P values evaluate equality in odds ratios between interventions.

