
Figure 1.
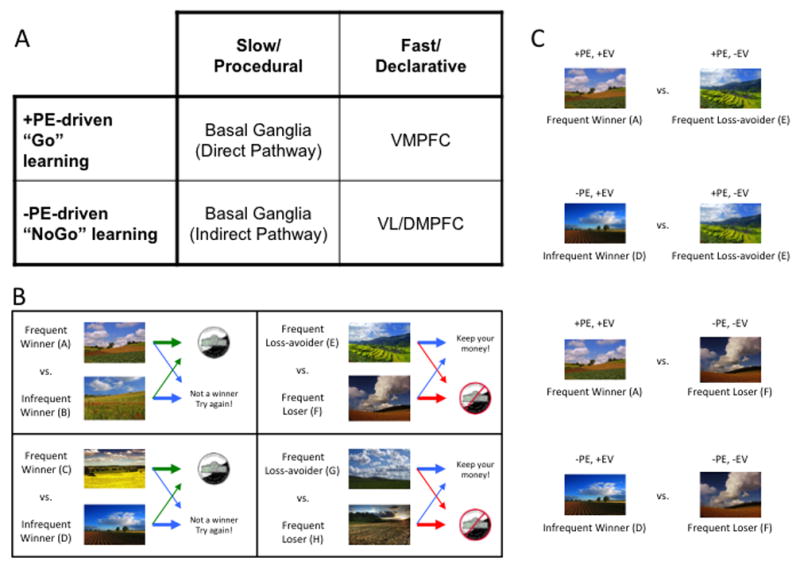
(A) Taxonomy of reinforcement learning mechanisms and their hypothesized neural substrates (see Frank and Claus, 2006, for details). Abbreviations: PE, prediction error; PFC, prefrontal cortex; VM, ventromedial; VL, ventrolateral; DM, dorsomedial. (B) Sample acquisition pairs from the Gain vs. Loss-avoidance probabilistic stimulus selection task. Individuals learn to choose the best stimulus from each of four pairs, based on the reinforcement probabilities of each stimulus. In two pairs, choices resulted in either a gain or a neutral outcome. In two other pairs, choices resulted in either a loss or a neutral outcome. Arrow thickness reflects probability of specific outcome. Green arrows denote gain, red arrows denote loss, blue arrows denote neutral outcome. (C) Sample transfer pairs from the Gain vs. Loss-avoidance probabilistic stimulus selection task. By prompting subjects to choose between stimuli associated with the same frequency of positive prediction errors, but difference expected values (e.g., between “Frequent Winner” stimuli vs. “Frequent Loss-avoider” stimuli), one can isolate the influence of expected value on choice. Abbreviations: PE, prediction error; EV, Expected Value.