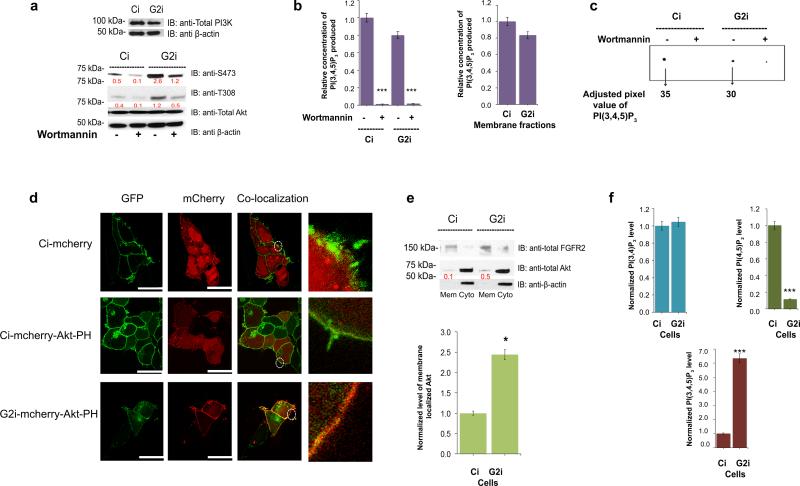
Figure 2. PI(3,4,5)P3 is generated equally by PI3K in Ci and G2i cells yet Akt membrane localization is enhanced in the latter.
(a) Upper western blot: Ci and G2i cells were serum starved and utilized for western blot analysis to detect the expression level of PI3K. Lower western blot: Untreated or Wortmannin treated cells (to ensure PI(3,4,5)P3 production is PI3K mediated) were used for western blot with pAkt as readout for inhibition efficiency.
(b) Left panel: PI3K was immuno-precipitated from untreated or Wortmannin treated cells on agarose beads using a PI3K specific antibody and used in a competitive ELISA assay. Absorbance at 450 nm was measured for samples run in triplicates (n=3) and used to extrapolate the amount of PI(3,4,5)P3 produced in each case (See Supplementary Figure 3e-h). Values were normalized against “untreated Ci” sample. Error bars denote standard deviation of the mean. Student's t-test indicates ***p≤ 0.001. Right panel: Same PI3K assay but in this case serum starved untreated Ci and G2i cells were subjected to fractionation first and only the membrane fraction was utilized in the experiment as an additional control to specifically quantify the membrane pool of PI(3,4,5)P3. The differences obtained were not statistically significant as determined by Student's t-test.
(c) Untreated or Wortmannin-treated cell lysates from Ci and G2i cells were used to detect the activity of intracellular PI3K by incubating fresh cell lysate with [32P]ATP and unlabeled PI(4,5)P2. The [32P]PI(3,4,5)P3 that was generated by PI3K was detected by TLC. Results of [32P] labeled lipids were visualized and quantified for adjusted volume as shown on the representative image.
(d) Ci and G2i cells transfected with an empty mCherry vector or mCherry-Akt-PH vector were serum starved and used for microscopy as explained in the Supplemental Experimental Procedures section. FGFR2-GFP was used as a membrane marker to show co-localization of the lipid binding PH domain on the membrane. Scale bar: 10 μm for empty mCherry vector and 25 μm for mCherry-Akt-PH vector. See also Supplementary Figure 4a for transfection efficiency.
(e) Top panel: serum starved Ci and G2i cells were fractionated into membrane and cytoplasmic portions and used for Western blot analysis then probed with the indicated antibodies followed by densitometric analysis. Bottom panel: graphical display of the quantified ratio of membrane total Akt to total FGFR2 (from 3 independent fractionation experiments) to show the increased Akt localization on the membrane. The red numbers on the blot presented in arbitrary units represent the ratio of total Akt to FGFR2 (the membrane marker).
Error bars denote standard deviation of the mean. Student's t-test was used to assess statistical significance *p≤ 0.05.
(f) Absorbance at 450 nm (assays are explained in the Supplementary Experimental Procedures section and shown in Supplementary Figure 4c-e) was used to extrapolate the amount of PI(3,4)P2, PI(4,5)P2 or PI(3,4,5)P3 produced. Values were averaged and normalized against Ci cells. Error bars denote standard deviation of the mean. ***p≤ 0.001 indicates a significant decrease in PI(4,5)P2 with a concomitant increase in PI(3,4,5)P3 in G2i cells compared to Ci cells.

