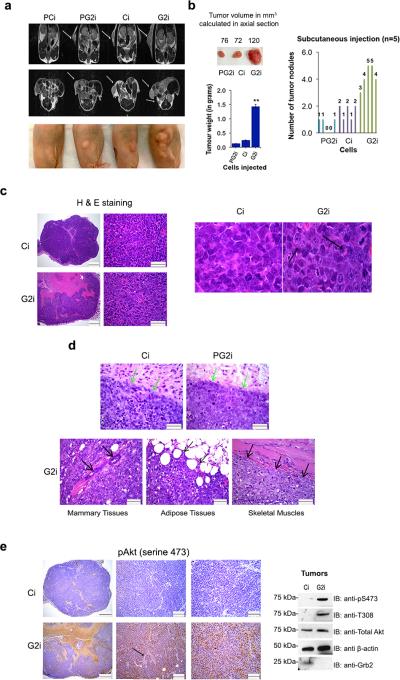
Figure 4. Knocking down Grb2 in FGFR2 expressing cells enhances their ability to form tumors with high levels of Akt phosphorylation.
(a) Top panel: Coronal MRI representative images of PCi, PG2i, Ci, G2i cell injected mice were taken following 60 days of subcutaneous injections. Arrows indicate the tumors formed. Middle panel: Axial MRI images of PCi, PG2i, Ci, G2i injected mice following subcutaneous injections. White arrows indicate the tumors formed. Bottom panel: A representative sample from each group (4 mice per group) showing both size and number of tumors formed.
(b) Upper panel (on the left): Tumor volumes were calculated in the axial sections obtained via MRI as explained in details in the Supplemental Experimental Procedures section. Results shown are the averages of the tumor volume in every group. Bottom panel (on the left): Tumors in every group were weighed (in grams) and averaged to generate a bar graph. Error bars denote standard deviation of the mean. Student's t-test was used to calculate the statistical significance with **p≤ 0.01. Right panel: Tumor nodules/mouse were counted and presented in a bar graph.
(c) Representative images of H & E staining of Ci and G2i tumors were taken at 40x and 600x to show infiltration to nearby tissues. Scale bars are 500 and 50 μm respectively. Images from 600x magnification were enlarged to show cellular morphology. Black arrows denote the nuclear/mitotic figures in G2i cells.
(d) Upper panels: Representative pictures of PG2i, Ci and G2i tumors (H & E staining) were taken at 400x magnification with a scale bar of 50 μm. Green arrows indicate the margins of PG2i and Ci tumors whereas black arrows (bottom panel) specify infiltration of G2i tumors into nearby tissues.
(e) Left panel: Representative images of pAkt staining of Ci and G2i tumors were taken at 40x, 200x and 400x. Scale bars are 500,100, 50 μm respectively. Black arrow is showing Akt phosphorylation in the perivascular region. Right panel: Western blot shows the level of Akt phosphorylation in tumor sections following sonication and protein extraction.

