
Figure 7. Landscape of MULTICOM’s ranking.
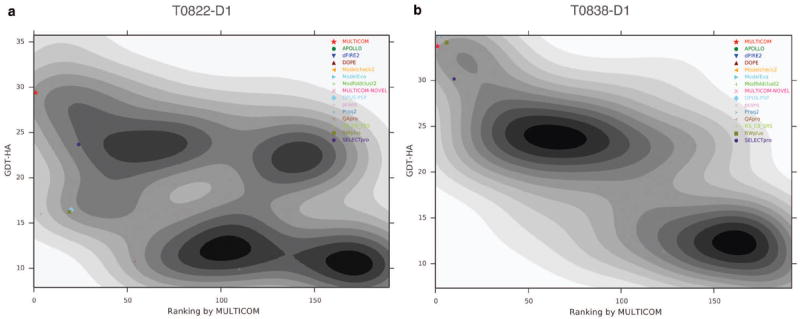
Gaussian kernel density estimates of GDT-HA score of models in the server pool and their ranking by MULTICOM are shown for targets (a) T0822-D1 and (b) T0838-D1 with lower rank indicating model predicted to be of higher quality. The top models selected by each of the QA methods are highlighted by different style and color. The corresponding legends are shown on the right.