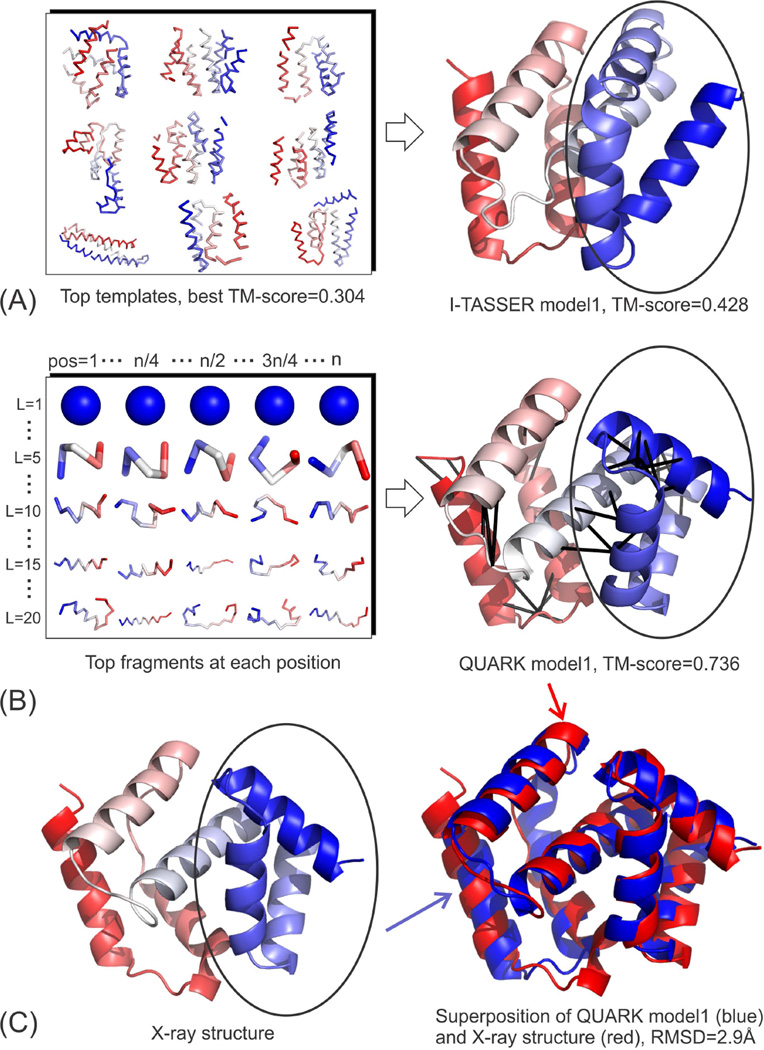
Figure 3.
Modeling procedure and the first model predicted for T0837-D1. (A) I-TASSER; (B) QUARK; (C) X-ray structure and the superposition of QUARK model1 and X-ray structure. The black lines on the QUARK model indicate the contacts predicted by the fragment-based distance profiles. Black circle highlights the N-terminal domain where I-TASSER model1 has the mirror image of native but I-TASSER model2 and QUARK model1 modeled it correctly.

