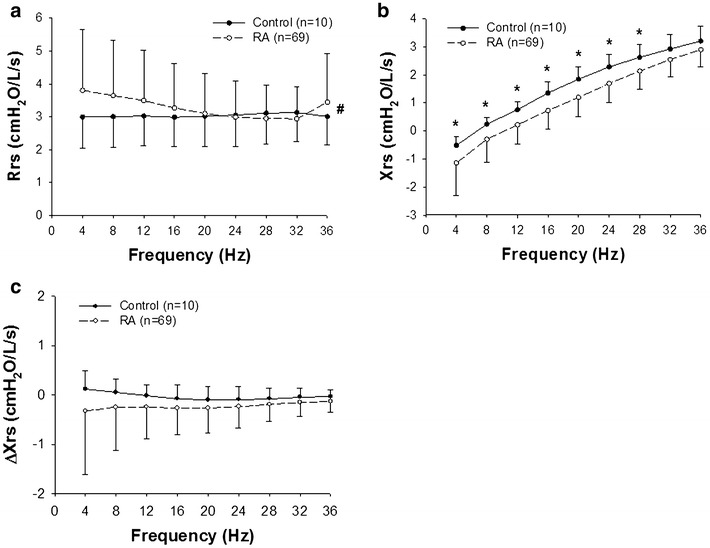
Fig. 3.

Rrs (a) and Xrs (b) during a whole breath in the RA (n = 69) and healthy control groups (n = 10) are compared. c Differences between inspiratory and expiratory phases (Δ) in Xrs (ΔXrs) calculated as mean inspiratory values minus mean expiratory values are also compared. Values are mean ± SD (cmH2O/L/s). *Significant difference (P < 0.05) between inspiratory and expiratory phases by two-way repeated measure ANOVA, followed by Bonferroni test for post hoc analysis. #There was a significant interaction in the Rrs curves between the group (either the RA or healthy control) and frequency (P < 0.001)
