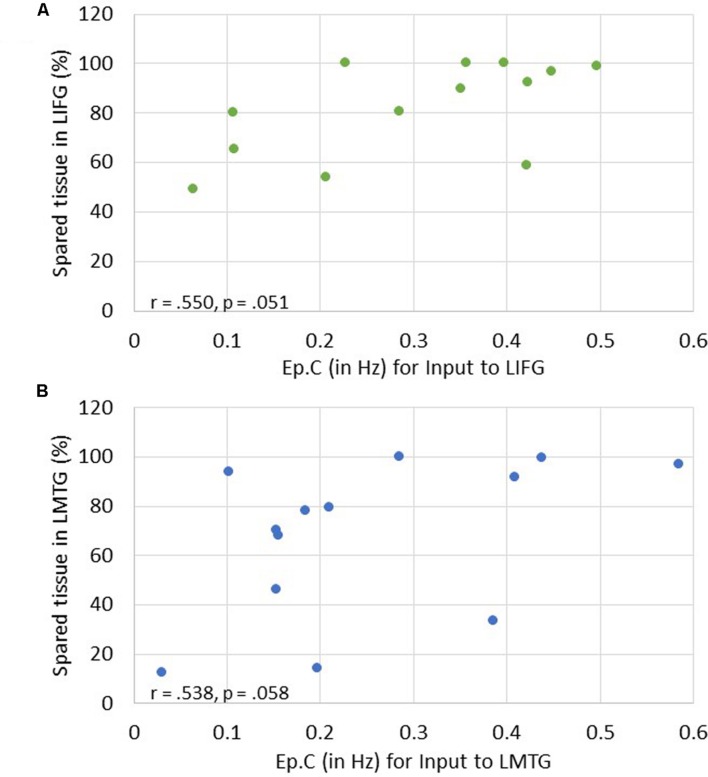
FIGURE 8.
Correlations between percentage of spared tissue and strength of task-induced perturbation to specific regions (i.e., Ep.C values in Hz). (A) For family #1, an association that approached significance was found between strength of driving input of LIFG and amount of spared tissue in LIFG. (B) For family #3, a trending association between driving input strength of LMTG and the amount of spared tissue in LMTG.

