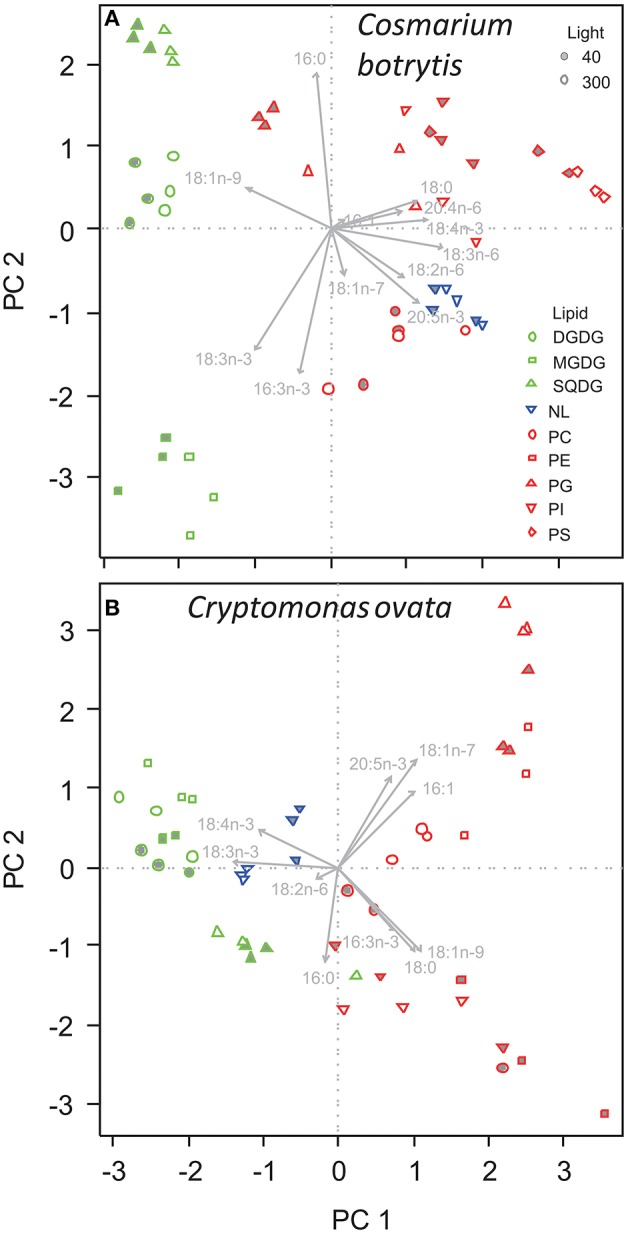
Figure 3.

Principal component analysis of the proportions of fatty acids in different lipid classes of (A) Cosmarium botrytis, and (B) Cryptomonas ovata grown under different light acclimation (40 and 300 μmol photons m−2 s−1). Details and color coding of lipids as in Figure 2.
