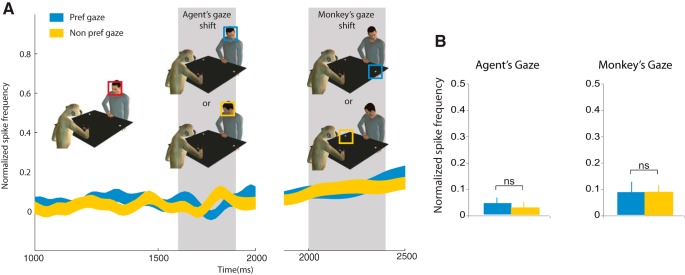
Figure 11.
Analysis of gaze-modulated MN population in relation to gaze shift. A, Neuronal response during agent's gaze shift for preferred gaze direction (blue square) and non-preferred gaze direction (yellow square), and (B) during monkey's own gaze shift. The time scale refers to the timeline of Figure 1. The gray shaded areas represent the gaze-shift epochs. Normalized activity of a population of 59 excitatory neurons (same population as Fig. 6). Note that both neurons with ipsilateral and contralateral gaze preference were included in this population. B, Mean response during the epochs of gaze shift (for agent and monkey). Paired sample t tests showed that the differences are not significant.

