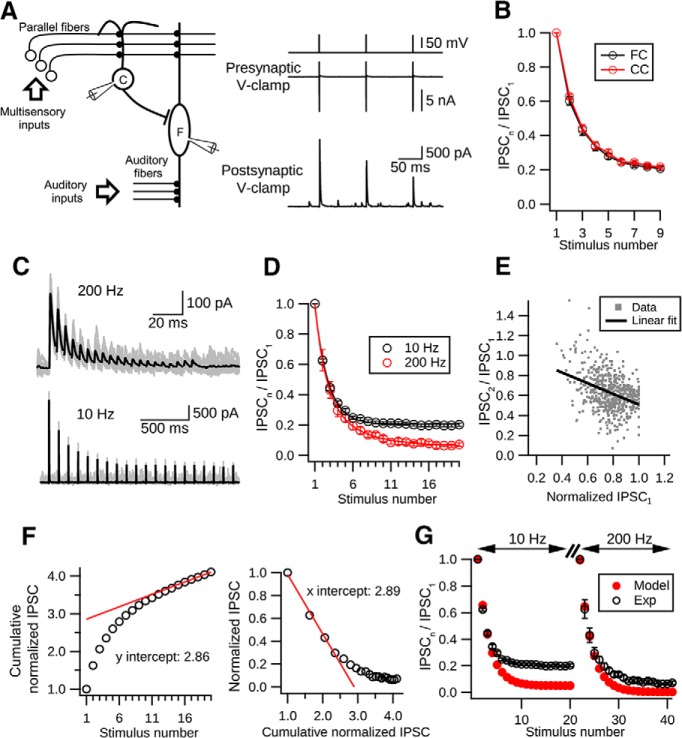
Figure 1.
Short-term depression at cartwheel cell synapses. A, Left, Simplified DCN circuit and paired recording diagram. Right, Example traces from a connected pair. Presynaptic cartwheel cell (C) was voltage-clamped at −60 mV and escaping spikes evoked by 0.2 ms voltage pulses of (80 mV). Corresponding IPSCs were recorded in the postsynaptic cell, in this case a fusiform cell (F). B, Kinetics of short-term synaptic depression in cartwheel-cartwheel connections (CC, red) and cartwheel-fusiform cell connection (FC, black) are not significantly different (p > 0.05, t test). Data collected from these two connections were therefore pooled (n = 10, CC; n = 5, FC). C, Example traces showing that synaptic depression occurs at low and high frequencies. Top, IPSCs evoked by 20 pulses of 200 Hz stimulation. Bottom, IPSCs evoked by 20 pulses at 10 Hz. Black traces represent the averages of at least 15 individual sweeps (gray). D, Summary of short-term depression at low and high frequencies. Black represents synaptic depression kinetics at 10 Hz. N = 15 connections. A single exponential function can be fit with a decay constant of 1.70 ± 0.04 stimuli. Red represents synaptic depression at 200 Hz. N = 6 connections. A double exponential function can be fit with 1.37 ± 0.18 stimuli and 4.57 ± 1.05 stimuli for fast and slow decay constants, respectively. Fast component is 59 ± 11% of fit. E, Negative correlation between the paired-pulse ratio (IPSC2/IPSC1) and peak amplitudes of IPSC1. N = 15 connections. Each gray dot represents the paired-pulse ratio with its corresponding IPSC1 amplitude in a single trial during 10 Hz stimulation. At least 20 trials were repeated for each connection. The peak IPSC1 amplitudes in each connection were normalized to the biggest IPSC1 amplitude in the same connection. Black line indicates a linear regression fit to all the dots. p < 0.001, R2 = 0.14, 581 points. F, Two approaches to estimating the size of the readily releasable pool and initial vesicular Pr. Left, Plot cumulative-normalized IPSCs against the stimulation number (open circles). The relative size of the pool is the y-intercept (2.86) of a linear regression line (red) back-extrapolated from the last 5 points. Right, Plot-normalized IPSC amplitude against the cumulative-normalized IPSC amplitude. The relative size of the pool is the x-intercept (2.89) of the linear regression line (red) extrapolated from the first 4 points. Both approaches give similar estimates for the Pr (left, 1/2.86 = 0.349; right, 1/2.89 = 0.346). G, Single-pool depletion model (Pr = 0.35, recovery time constant: 5.5 s) cannot account for cartwheel synaptic depression. Black represents experimental data. Red represents model predictions. The model matches the first 4 data points during depression but greatly overestimates the degree of depression in both 10 Hz and 200 Hz evoked responses.

