Figure 5.

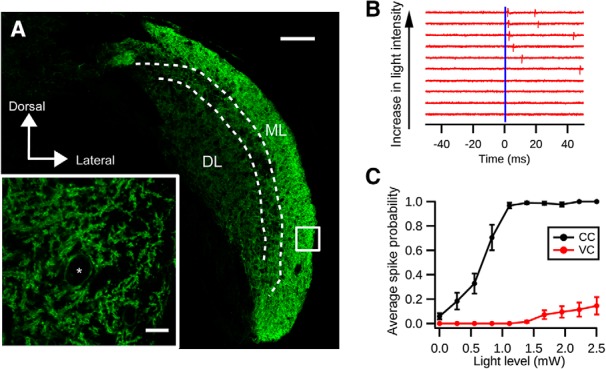
Optogenetic activation of cartwheel cells. A, Immunolabeling of ChR2-EYFP in a coronal section of DCN from a GlyT2-Cre;Ai32 animal. Strong expression of ChR2-EYFP is seen in the DCN molecular layer (ML), where cartwheel cells are located. The deep layer (DL) shows less dense expression of ChR2-EYFP. Scale bar, 100 μm. Inset, Single focal plane image of the white selection. There is strong labeling of ChR2-EYFP in spiny dendrites characteristic of cartwheel cells. *Possible cartwheel cell soma. Scale bar, 10 μm. B, Cartwheel cell spikes with blue light flash. Example traces of a cell-attached recording from a cartwheel cell in response to blue light of different intensities. Blue bar represents the onset of the light stimulation (duration: 0.5 ms). Each red vertical stroke represents an action potential. The spike probability and response latency decrease with increasing light intensity. C, Population averages of spike probability (the chance of generating a spike within 10 ms after the light stimulation) from cartwheel cells (CC, black, n = 9) and vertical cells (VC, red, n = 13). Only 3 of 13 vertical cells respond to light stimulation stronger than 1.5 mW; and even with 2.5 mW blue light stimulation, the spike probability is low (0.15 ± 0.07).
