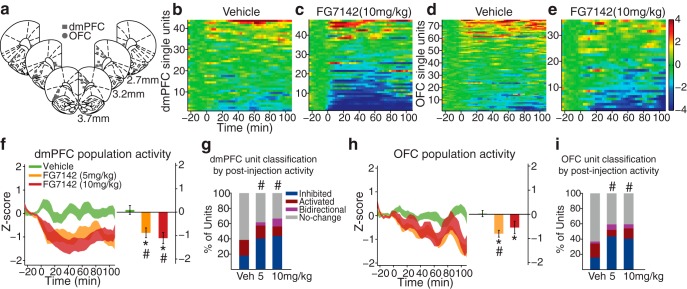
Figure 1.
Modulation of PFC single-unit and population activity by FG7142. a, Histologically verified placements of dmPFC (squares) and OFC (circles) electrodes used for home cage and set-shifting task recording. b, c, The baseline-normalized activity (Z-score) of all dmPFC single units before and after vehicle (b) or 10 mg/kg FG7142 (c) injection. Baseline activity is normalized to 0, and injection occurred at time = 0. Each row represents activity of an individual unit arranged by direction and magnitude of activity change. The number of units (n) and rats (N): vehicle, n = 44, N = 8; 5 mg/kg, n = 47, N = 7; 10 mg/kg, n = 47, N = 7. d, e, The baseline-normalized activity of all OFC single units: vehicle, n = 76, N = 9; 5 mg/kg, n = 71, N = 10; 10 mg/kg, n = 37, N = 8. f, Left, The normalized dmPFC population activity before and after FG7142 or vehicle injection, displayed as mean ± SE (shaded area). Right, The mean population activity averaged across the entire postinjection period. *Statistically significant difference compared with preinjection baseline. #Statistically significant difference compared with vehicle. Error bars indicate SE. FG7142 injection led to suppression of the population activity compared with the preinjection baseline or the vehicle control. g, Proportion of dmPFC units classified based on the postinjection activity. #Significant difference in the distribution of classified units compared with the vehicle. Increased proportions of FG7142-injected units were classified as inhibited compared with vehicle units. h, The normalized OFC population activity and the mean population activity during the postinjection period. i, Proportion of OFC units classified based on the postinjection activity.

