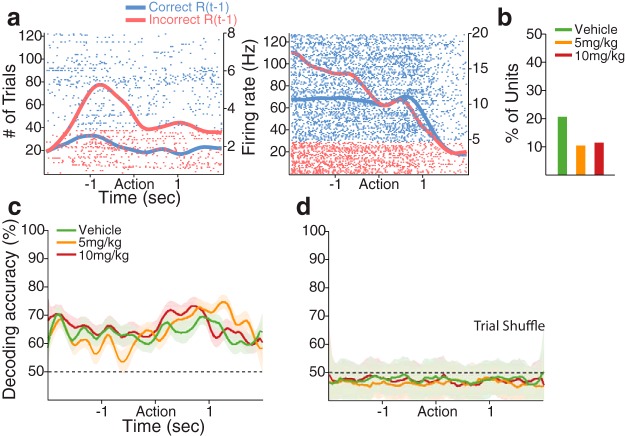
Figure 5.
dmPFC encoding of the previous response outcome: R(t − 1). a, Spike raster plots of two example dmPFC units encoding the previous response outcome during the preaction period. Each row represents each trial. Each tick mark indicates a spike. Horizontal axis represents time before and after the action occurring at time = 0. Left vertical axis represents the number of trials. Right vertical axis represents the firing rate. The spike density functions for previously correct and incorrect trials estimated with a Gaussian kernel (σ = 100 ms) are superimposed in each raster plot. b, Proportions of vehicle and 5 and 10 mg/kg exposed units encoding the previous response outcome were not significantly different (n = 13, n = 7, and n = 7, respectively). c, Representation of the previous response outcome in the dmPFC population, measured by the decoding accuracy of a linear classifier. Each color-coded line indicates the decoding accuracy for the previous response outcome in each dose group (vehicle, 63 units; 5 mg/kg, 67 units; 10 mg/kg, 61 units), displayed as mean ± SD (shaded area) across 50 resamplings. Black dotted line indicates the level of decoding expected by chance. d, Shuffling the trial ID quenched the decoding accuracy for the previous response outcome to approximately the chance level.

