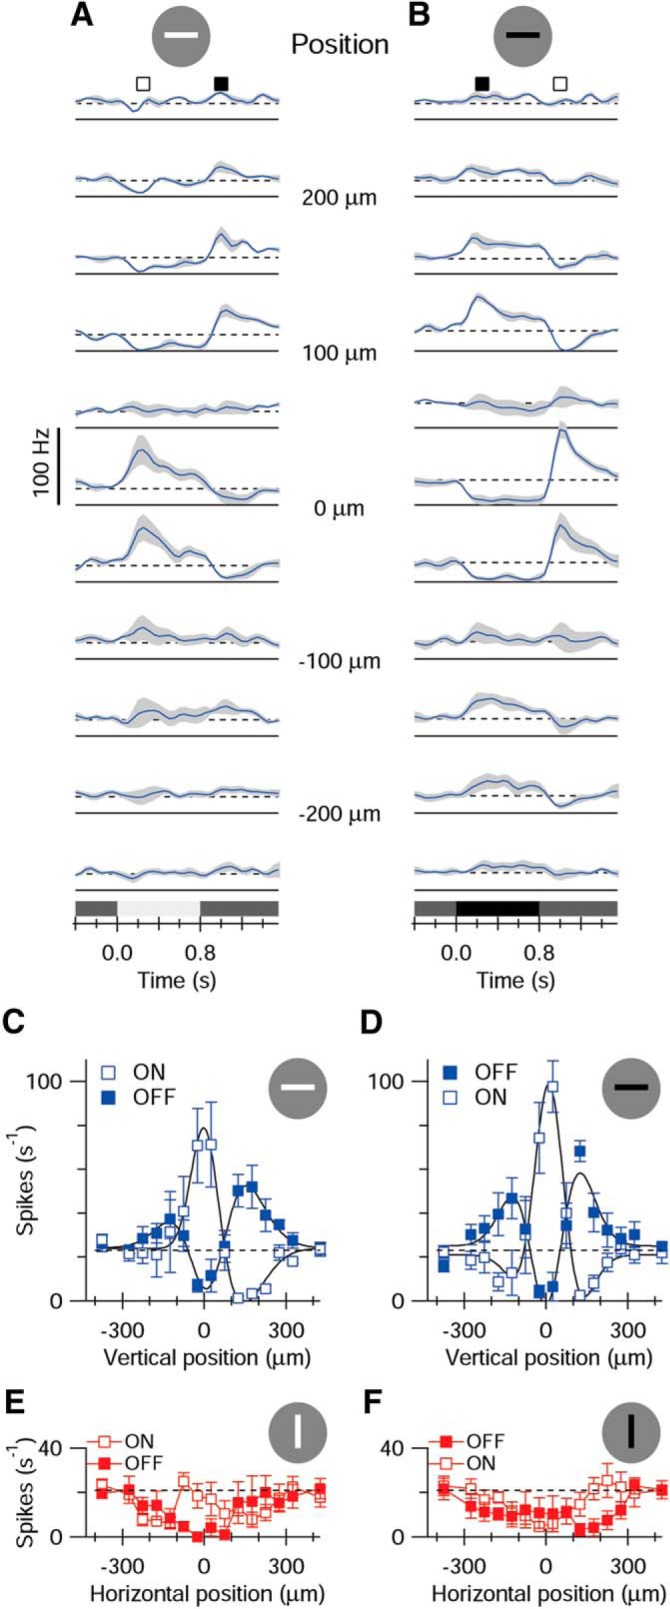
Figure 2.

RF structure. A, B, Average PSTHs for 5 cells obtained for horizontal stimuli offset vertically by 50 μm between each trace. Shading represents SEM. The locations of the bar relative to the RF center are indicated between the traces. The vertical spike calibration applies to both sets of traces. The stimulus is shown schematically at the top. C, D, Mean spike rates measured during a 20 ms time-window centered on the corresponding symbols shown in A, B. Open symbols represent ON responses. Closed symbols represent OFF responses. E, F, Same format as C, D for vertical bars offset horizontally across the RF. The corresponding PSTHs are not shown. C–F, Error bars indicate SEM.
