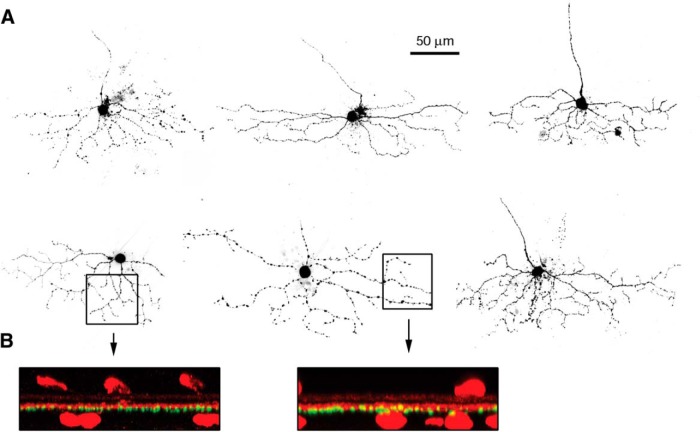
Figure 3.
Anatomical structure of ON-OSGCs. A, Fluorescence micrographs of 6 cells from which patch-clamp recordings were made. Note the elongation of the dendritic arbors parallel to the horizontal dimension. B, Vertical projections of 2 cells showing the narrow stratification of the OSGC dendrites. Red fluorescence shows ChAT staining as a reference for the stratification level. ON-OSGC dendrites (green) were narrowly stratified just below the inner ChAT band, within sublamina 4.

