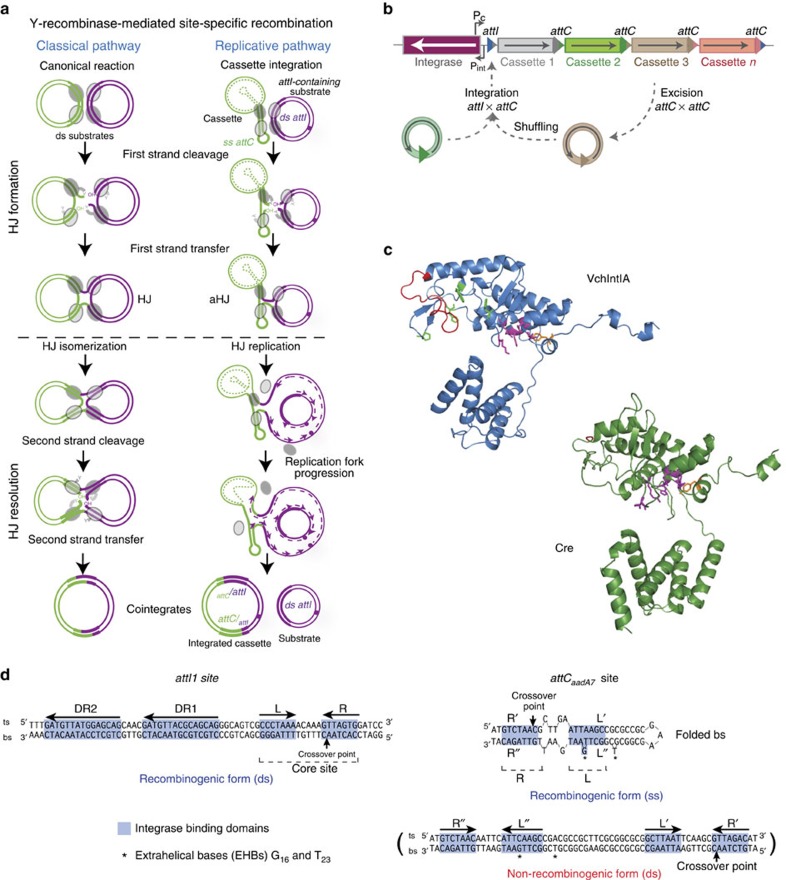
Figure 1. Recombination in the integron.
(a) Diagram showing the two recombination models among tyrosine recombinases. The left column shows the recombination pathway shared by a majority of Y-recombinases, except the integron integrase for which the pathway is represented in the right column. (b) Schematic representation of the integron architecture and recombination reactions. Open reading frames are represented as boxes, with arrowheads showing the direction of transcription. Arrows marked as Pc and Pint represent the promoters of the cassette array and the integrase, respectively. Acquisition of new cassettes involves the recombination of the integron attI site and the cassette attC site, while cassette excision involves two attC sites. Sequential coupling of excision and integration reactions shuffles the order of cassettes within the array. (c) Crystal structure of V. cholerae integrase20 (blue) and Cre60 (green). RKHRH residues are depicted as purple sticks. The catalytic tyrosine is shown in orange. Red residues represent the I2 domain in VchIntIA and the residues in Cre that align with those delimiting I2 in VchIntIA. Residues in VchIntIA that interact with EHBs are represented in green. (d) Sequence of the Class 1 integron attI site (attI1), and the attCaadA7 site. aHJ, asymmetric HJ; bs, bottom strand; DR, direct repeats; ds, double stranded; HJ, Holliday junction; ss, single stranded; ts, top strand.

