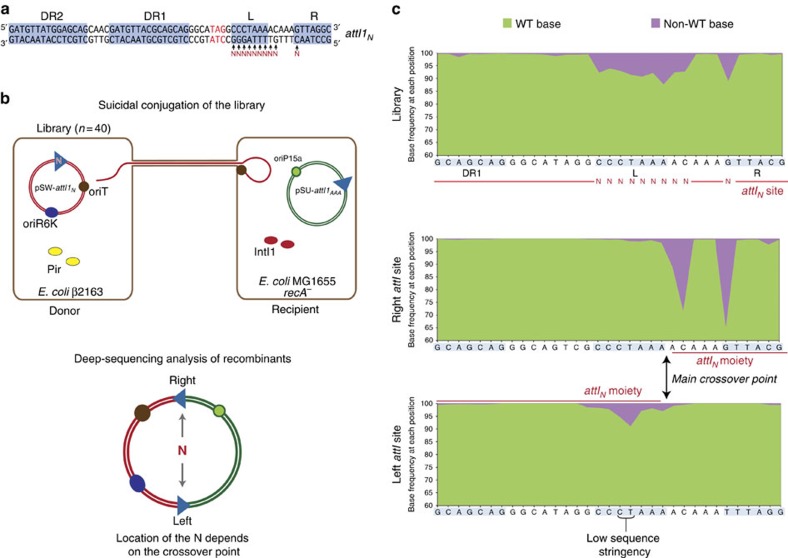
Figure 4. Mapping of the crossover point on the top strand.
(a) Positions randomized in the attISTOP site to produce the attIN library (n=40). The theoretical frequency of bases in every randomized position is of 92.5% WT base and 2.5% of every other base. (b) Diagram of the experimental set-up and recombination reaction. Recombination between attIN and attIAAA takes place through the top strand, splitting the randomized bases between moieties in the resulting sites of the cointegrate (right and left). (c) Graphical representation of base frequency within the attIN library before recombination, and the right and left sites after recombination. Green, WT base; Purple, non-WT base.

