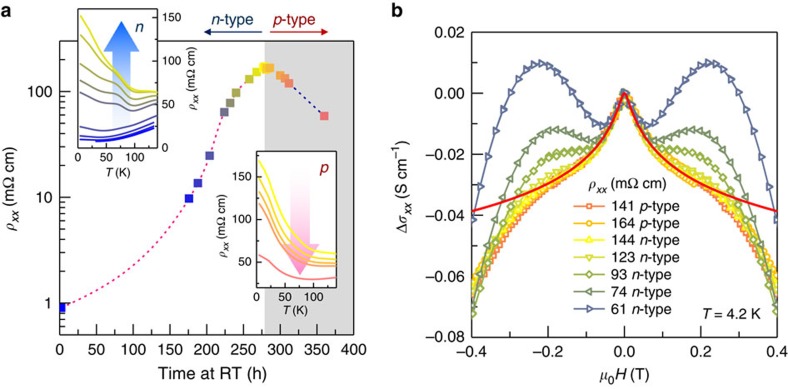
Figure 3. Time evolution of charge transport across charge neutrality point in Bi2Te3 after low-dose exposure.
(a) Evolution of longitudinal resistivity ρxx measured at 4.2 K after cycling to room temperature (RT) for a crystal irradiated with dose ϕ=90 mC cm−2. Each RT dwell time is coded with a different colour. Resistivity is seen to cross charge neutrality point (CNP) in reverse from n-type back to p-type. It is consistent with slow migration (hundreds of hours at RT) of vacancies (in accord with ∼0.8 eV migration barriers, see text) and shows that CNP can be reached by designing a suitable thermal protocol. Insets show ρxx(T) for n-type region (upper left) and p-type region (lower right). (b) Change in magnetoconductance (MC) at different RT dwell times; here MC evolves from a quadratic field dependence of a typical bulk metal at short RT dwell times, through a complex region dominated by the charge-inhomogeneous bulk, to a weak antilocalization (WAL) region showing the characteristic low-field cusp near CNP. Here the data were normalized to the value at zero field. A fit to 2D localization theory26 is shown as red line, see text.

