
Fig. 2.
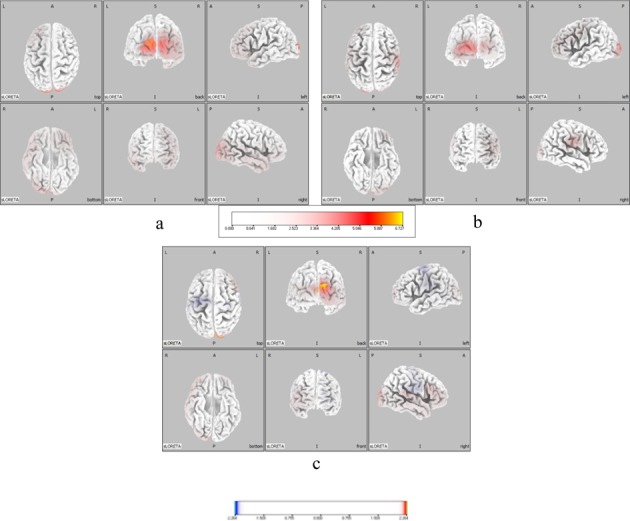
Neural activity in the μ-wave range during vibratory stimulation. a: Neural activity in the μ-wave range of the healthy group. b: Neural activity in the μ-wave range of the patient group. Brain areas where the μ- and α-waves significantly increased are indicated in yellow and red.. c: Comparison of the neural activities of the healthy and patient groups. Areas of brain where the μ- and α-waves significantly increased in the healthy group compared to the patient group are indicated in yellow and red, and areas of the brain where the μ- and α-waves significantly increased in the patient group compared to the healthy group are indicated in light blue and blue. Color scale values below the images indicate t-values (t = 2.264)