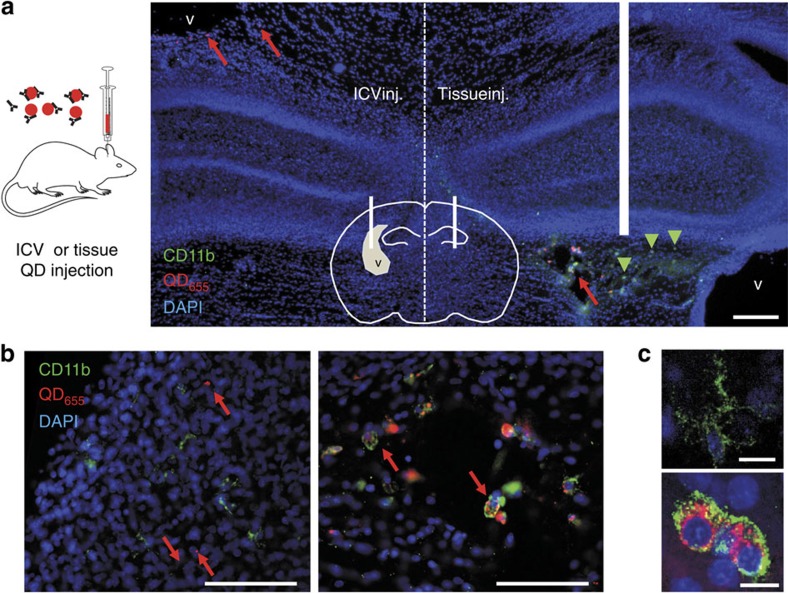
Figure 1. Comparison between intra-ventricular injection and local brain-tissue injection of QD.
(a) Rats were injected with functionalized QD (shown in red) inside a lateral ventricle in one hemisphere and directly in brain tissue in the opposite hemisphere. Pups were perfused with PFA 3 h after injection, and coronal cuts were immunostained with CD11b antibodies (shown in green). Nuclei were stained with DAPI (shown in blue); scale bar, 200 μm. (b) Magnified images of both hemispheres (from regions marked with red arrows) are shown below, corresponding to a region close to the lateral ventricle (left) and a region close to the brain-tissue injection point (right), where activated microglia are detected with large amount of phagocyted QD (scale bars, 100 μm). (c) The morphology of microglia with high concentration of engulfed QD changes dramatically due to cell activation (top: non-activated; bottom: activated), also increasing the levels of CD11b expressed by microglia (scale bars, 10 μm). ICV, intra-cerebroventricular.

