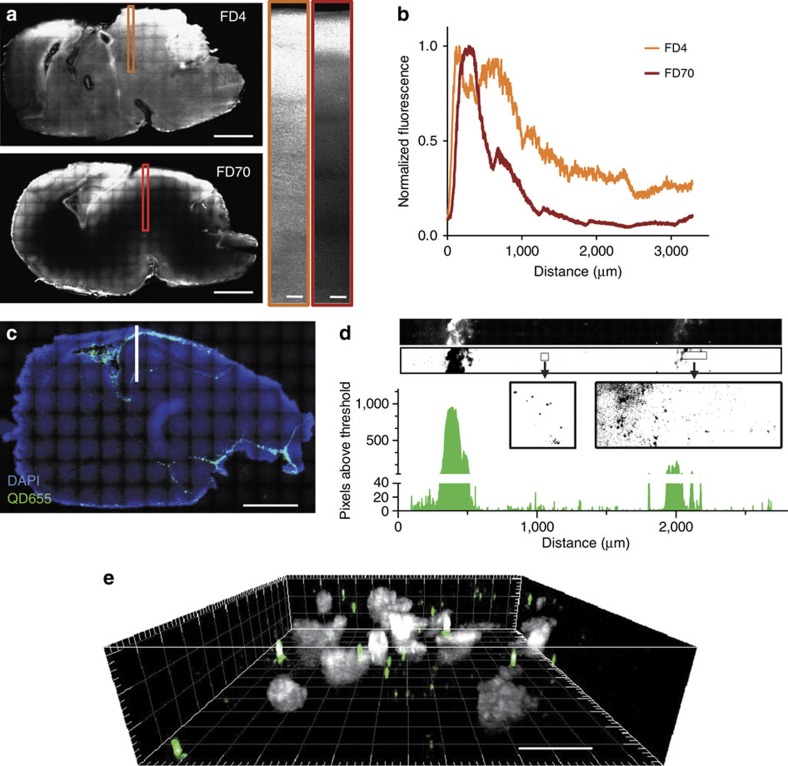
Figure 2. Distribution map of injected Dextran and QD in rat brain.
(a) Intra-ventricular injections of FD4 (top) and FD70 (bottom) allow diffusion of dextran into the brain tissue (full-brain scale bars, 2 mm, magnified sections' scale bars, 100 μm). Smaller dextran (FD4) diffuses faster and further away from the ventricles than larger dextran (FD70), as can be seen in the plotted intensity profiles (b) corresponding to the intensity detected across the marked orange and red rectangles in the brain sections shown. (c) Intra-ventricular injections of QD show similar diffusion patterns to that of injected fluorescent dextran (particularly FD70). The image corresponds to a low magnification map of a 50 μm thick sagittal cut of P1 rat brain, injected with QD and killed and fixed with PFA 3 h later (scale bar, 2 mm). The map was composed stitching 120 images taken at × 10 magnification in a spinning disk confocal microscope (DAPI is shown in blue, QD shown in green). High-magnification image showing QD in the brain region marked with white line (including part of cortex, ventricle and hippocampus) is shown in d. The high magnification map was composed stitching 90 images taken at × 100 magnification in a spinning disk confocal microscope, subsequently thresholded and the pixels above threshold quantified, showing how QD diffuse into the brain hundreds of microns away from the cerebrospinal fluid ventricles. A section of this high-magnification image was studied in three dimensions (e) showing that QD (green spots) are distributed across the slice volume (DAPI in grey) and the detected QD in the brain are not dispersed as an artefact of the slicing procedure (scale bar, 10 μm).

