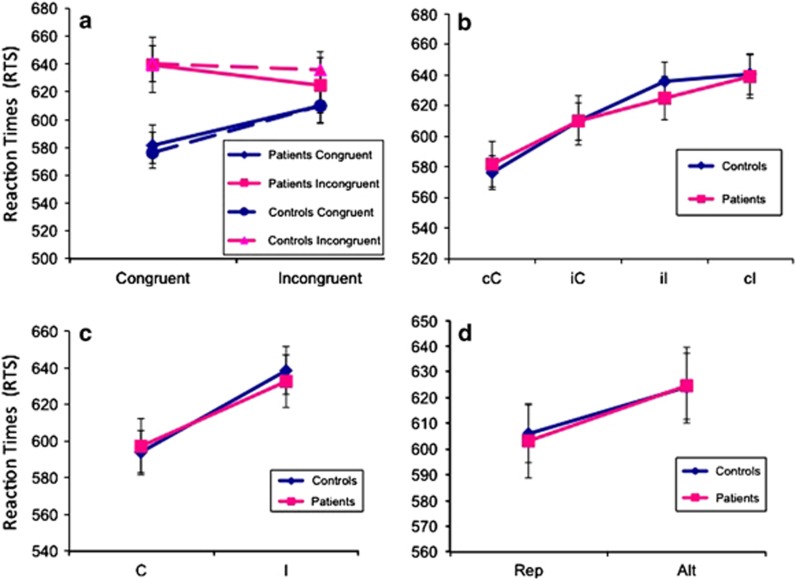
Figure 1.
Reaction times. (a) RTs (in milliseconds) for current trials are displayed on the Y axis and plotted as a function of the type of trial (c or i) preceding the current trial (C or I). Blue indicates current congruent trials (C) and pink indicates current incongruent trials (I). The broken line refers to controls and the solid line to CHR participants. The difference in RT between incongruent and congruent trials is usually reduced if the preceding trial is also incongruent. This reduction in RT difference, known as Gratton effect or congruency sequence effect, was observed in our data. We detected no statistically significant differences in RTs between CHR participants and controls. (b) RTs in milliseconds are displayed on the Y axis as a function of current trial type going from the easiest to the most difficult. cC: congruent trial preceded by congruent trial; cI: incongruent trial preceded by congruent trial; iC: congruent trial preceded by incongruent trial; iI: incongruent trial preceded by incongruent trial. CHR participants and healthy controls engage equally during performance of the Simon task. Between-group differences in reaction times across the same condition were not significant. (c) RTs in milliseconds are displayed on the Y axis as a function of congruence or incongruence of the current trial (I or C), regardless of prior trial type. (d) RTs in milliseconds are displayed on the Y axis as a function of trial repetition (cC or iI) or trial alternation (cI or iC).

