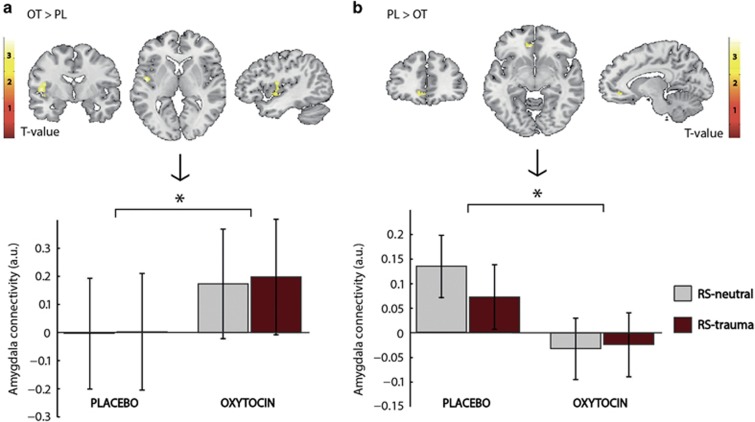
Figure 4.
Main effect of oxytocin on amygdala–insula resting-state functional connectivity to script-driven imagery. Above, the statistical maps of the t-contrasts OT>PL (a) and PL>OT (b) over both script conditions (threshold at puncorr <0.01 for graphical purposes) is overlaid on a single subject template brain ((a): peak voxel [x y z]=[−48 −6 4] (b): peak voxel [x y z]=[−8 38 −8]). For both script conditions and treatment groups (placebo n=18; oxytocin n=19), the bar graphs below depict the mean contrast estimates of main treatment effects (extracted from the depicted clusters) adjusted for baseline re-experiencing symtpoms and frame wise displacement. Error bars represent the SD's, also adjusted for baseline re-experiencing symptoms and frame wise displacement. *Significant t-contrast at pSVC <0.05, all analyses carried out in SPM (Statistical Parametric Mapping); RS, resting-state; SVC, small volume correction.

