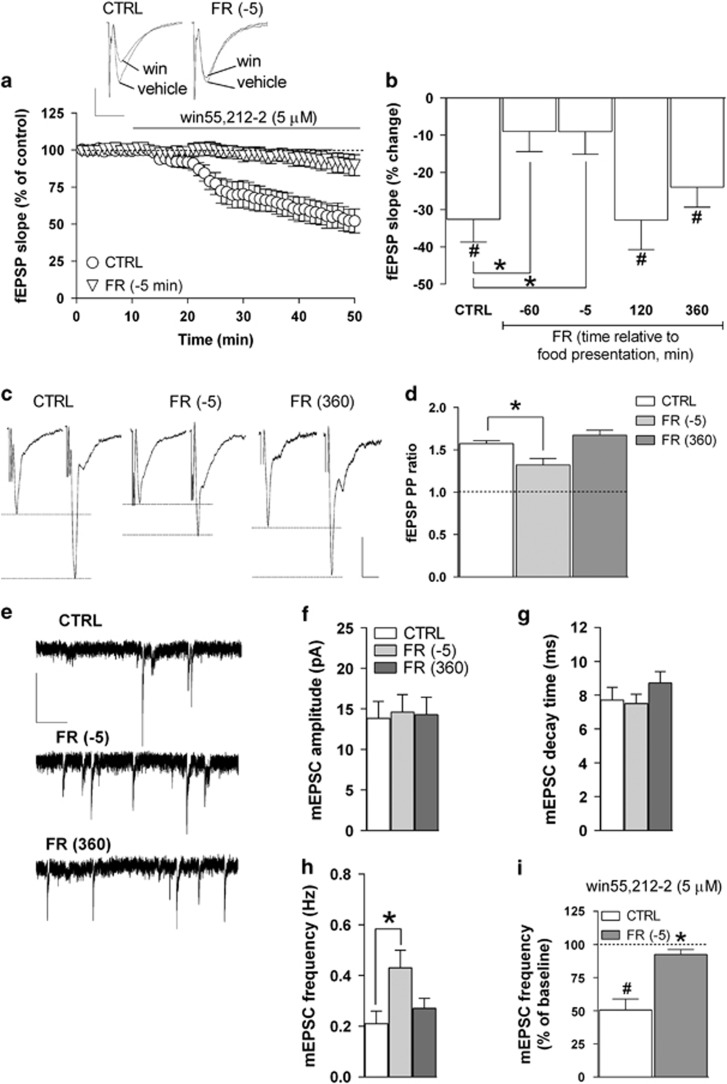
Figure 1.
Effects of FR on CB1 receptor function and glutamatergic transmission in the hippocampal CA1 field. (a) Scatter plot relative to the effect of 5 μM win55,212-2 on fEPSP slope recorded in the stratum radiatum of the CA1 field from CTRL and FR rats killed 5 min before food presentation. Representative traces of fEPSPs showing the effect of win55,212-2 in slices from CTRL and FR killed 5 min before food presentation are shown above (scale bars: 1 mV, 10 ms). (b) Bar graph reporting the percent change of fEPSP slope value from baseline induced by win55,212-2 in slices from CTRL and FR rats that were tested at different time intervals relative to food presentation (n=5–16). (c) Representative traces of fEPSPs recorded in the CA1 field from CTRL and FR rats (killed 5 min before and 360 min after food presentation). Two stimuli (PP) were delivered with an inter-interval of 50 ms, and the ratio between the slope of the second and the first fEPSP was calculated (scale bars: 1 mV, 10 ms). (d) Bar graph illustrating the averaged PP ratio values for CTRL and FR rats (n=5–12). (e) Representative traces of mEPSCs recorded in CA1 pyramidal neurons in the presence of kynurenic acid (1 mM) and lidocaine (500 μM; scale bars: 10 pA, 1 s). (f–h) Bar graphs summarizing the basal properties (amplitude, decay time, and frequency) of mEPSCs from CA1 pyramidal neurons (n=12–16). (i) Bar graph showing the effect of 10-min bath perfusion of win55,212-2 (5 μM) on mEPSC frequency in slices from CTRL and FR rats killed 5 min before food presentation (n=5). Data are means±SEM. *P<0.05 vs CTRL. #P<0.05 vs baseline, one-way ANOVA and Bonferroni post hoc test. CTRL, control group; fEPSP, field excitatory postsynaptic potential; FR, food restriction; mEPSC, miniature EPSC; PP, paired-pulse.

