Figure 2.
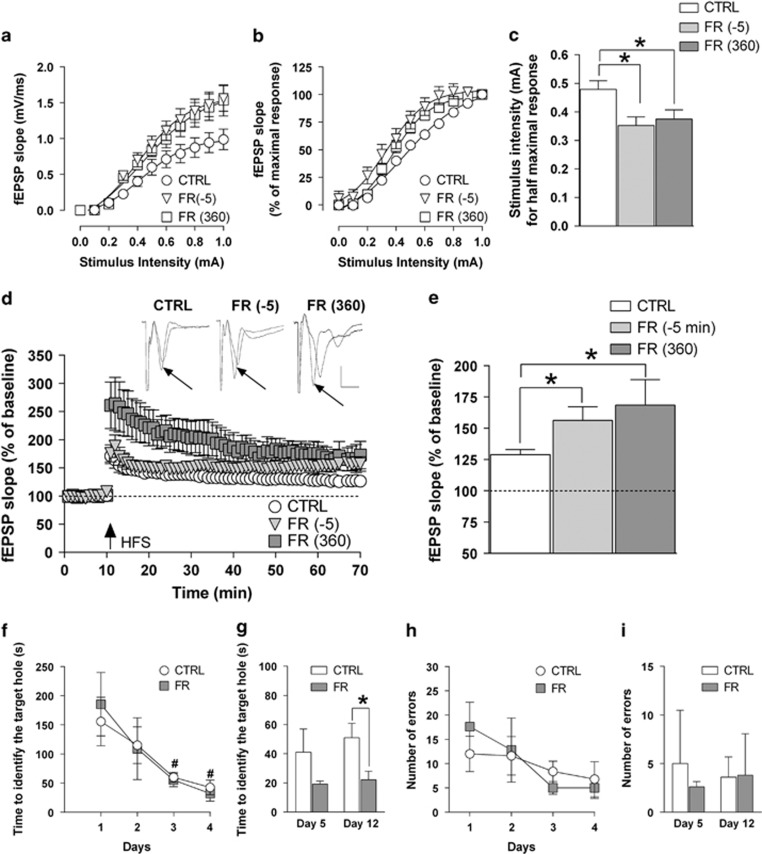
Effects of FR on neuronal excitability, LTP formation in the CA1 field, and spatial learning and memory. (a, b) Input–output (I–O) curves determined in slices from CTRL and FR rats (killed 5 min before and 360 min after food presentation) by measuring fEPSP slope in response to stimulation of Schaffer's collaterals with current steps of increasing intensity (from 0 to 1.0 mA). Data are expressed as absolute values (mV/ms) in panel a and as percentage of the corresponding maximal response in panel b (n=6–14). (c) Bar graph of the current intensity producing the half-maximal response calculated from the I–O curves shown in panels a and b. (d) Scatter plot representing the percentage change in fEPSP slope values induced by HFS with respect to baseline in rats of the different experimental groups. Above, representative traces of fEPSPs before and 1 h after HFS application (black arrow) are shown (scale bars: 1 mV, 5 ms). (e) Bar graph of the averaged fEPSP slope values obtained during the last 10 min of LTP recording, compared with the relative baseline (n=5–17). *P<0.05 vs CTRL, one-way ANOVA followed by Bonferroni post hoc test. (f–i) Performance of CTRL and FR rats in the Barnes maze. The time(s) needed to identify the target hole is shown either for the four consecutive training sessions (f) and for the test for the short- (day 5) and long-term (day 12) spatial memory (g). Number of errors during training sessions and during the test days is also shown in panels h and i, respectively (n=5). *P<0.05 vs CTRL, Student's t-test. #P<0.05 vs first training session, one-way ANOVA followed by Bonferroni test. CTRL, control group; fEPSP, field excitatory postsynaptic potential; FR, food restriction; HFS, high-frequency stimulation; LTP, long-term potentiation.

