Figure 4.
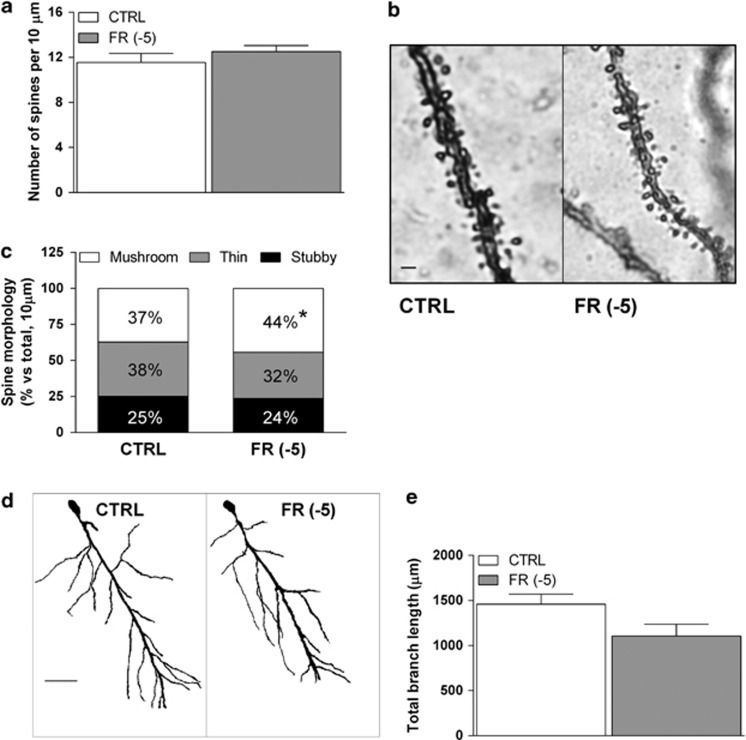
Effects of FR on dendritic spine density and morphology in the rat hippocampal CA1 field. (a) Bar graph summarizing the total dendritic spine density of Golgi-impregnated pyramidal neurons of the hippocampal CA1 field. (b) Representative images of Golgi impregnated basal dendrites of CA1 pyramidal neurons (scale bar: 1 μm). (c) Bar graph summarizing the relative density of spines with different morphology as calculated in a 10-μm dendritic section of the different experimental groups. (d) Representative images of Golgi impregnated pyramidal neurons of the hippocampal CA1 field from CTRL and FR rats (scale bar: 50 μm). (e) Bar graph reporting the averaged total branch length of dendrites of CA1 pyramidal neurons from CTRL and FR rats. Data are means±SEM from 5 to 7 animals per group. CTRL, control group; FR, food restriction.

