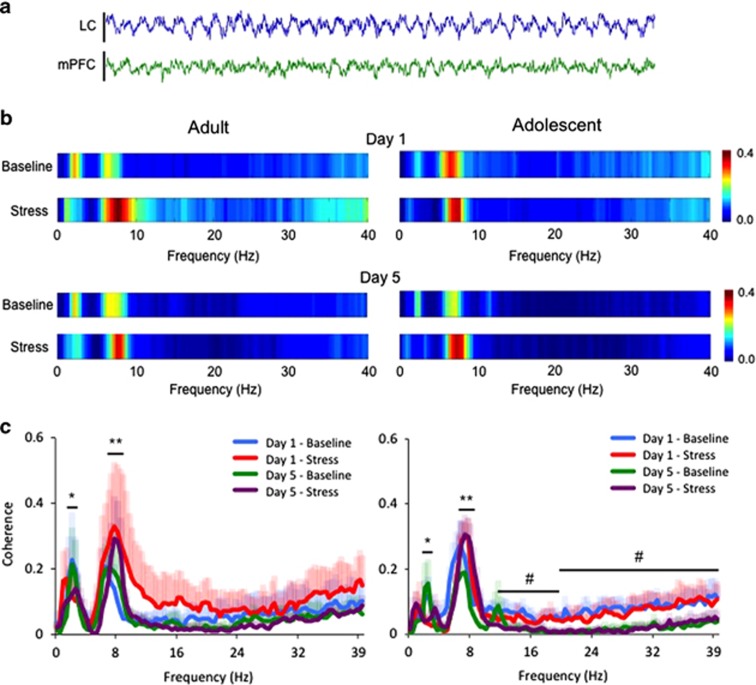
Figure 4.
Age-dependent effects of social stress on coherence between the LC and PFC LFPs. (a) Representative raw traces of LFPs in the LC and mPFC simultaneously recorded from an adolescent animal at baseline over a 5-s period. (b) Heat maps displaying the average coherence value at different frequencies recorded in each group on days 1 and 5. (c) Line plots showing the effect of a single or repeated stress on LC-mPFC coherence in adolescent and adult rats. The ordinates show the mean coherence values and the abscissae indicate different frequencies (Hz). Note the stressor-mediated shift in coherence, increasing coherence between 7 and 9 Hz and decreasing within the 2–3 Hz range. Shaded error bars are color matched to the corresponding time/day, representing +1 SEM. *p<0.05, **p<0.01; stress effects. Also note the diminished activity in the high frequency beta (12–20 Hz) and gamma (20–40 Hz) range from day 1 to day 5 in adolescent animals. #p<0.05; day effects.

