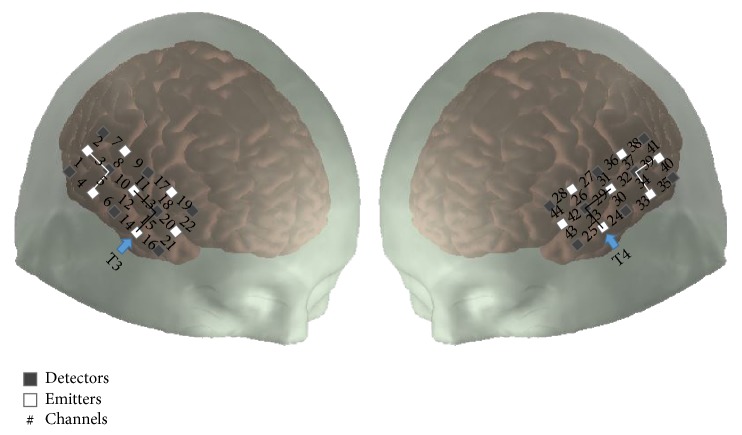
Figure 1.
Configuration of channels (numbers) with identified detectors (dark gray squares) and emitters (white squares) over the right and left cortical hemispheres. There are 8 detectors and 7 sources resulting in 22 channels per hemisphere. The unit of concentration is micromolar (μM). Interconnected blocks with the solid black line represent the region of interest (ROI; primary auditory regions; channels 13, 15, 23, and 29). Interconnected blocks with white line represent the nonregion of interest (non-ROI; (channels 3, 5, 34, and 39)). T3 and T4 are the reference points of the International 10–20 System [21].

