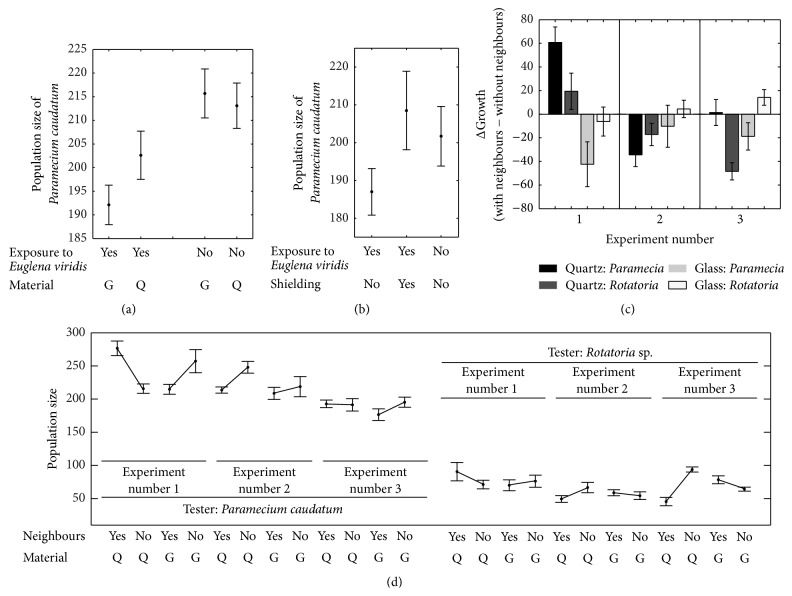
Figure 1.
(a–d) represent graphically the results from experiments 1a and 1b and 2. (a) Glass- and quartz-separated populations of Euglena viridis affecting populations of Paramecium caudatum. (b) As in (a) but with graphite shielding and quartz-separation only. (c) refers to experiment 2 and displays the effect of Rotatoria sp. on Paramecium caudatum andvice versa. The x-axis shows the three repetitions of experimental blocks and the y-axis values of growth with inducer species as neighbour minus growth of controls. (d) refers to the same experiment as in (c) but shows the actual growth values of each treatment group for all three repetitions of experimental blocks.

