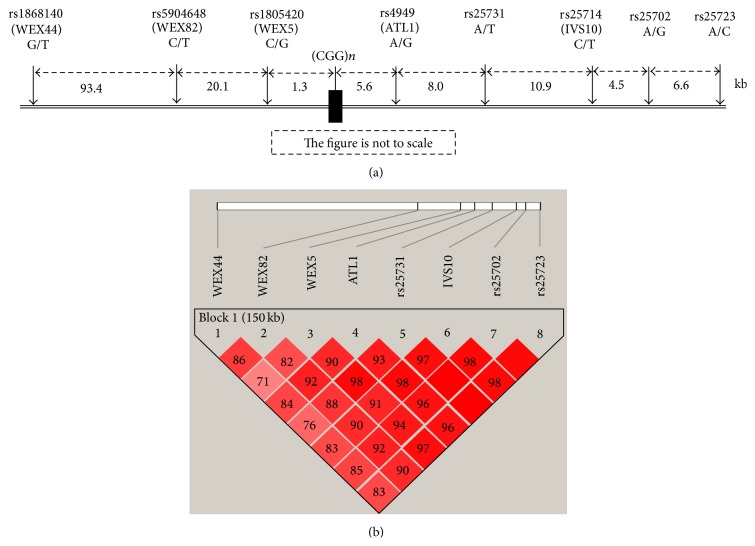
Figure 1.
(a) The locations of the 8 SNPs. SNP-alleles of each locus are indicated under the SNPs. The distance between each SNP in Kb is shown below. The figure is not to scale. (b) Linkage disequilibrium (D′) plot of the 8 SNPs within 150 kb of the CGG-FMR1 gene. All SNPs pairs have high D′ values, more than 80 or close to 80.

