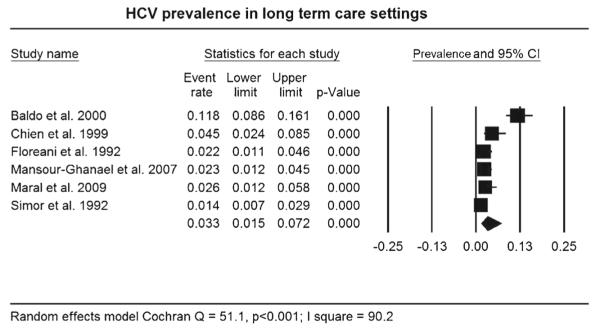
Fig. 2.
Forest plot of HCV infection prevalence in older adults in long-term care settings
Note: Squares represent effect sizes of individual studies with extended lines denoting 95% confidence intervals (CI). Sizes of squares indicate the weight of each study based on sample size using a random effects analysis. The diamond represents the estimated pooled prevalence.

