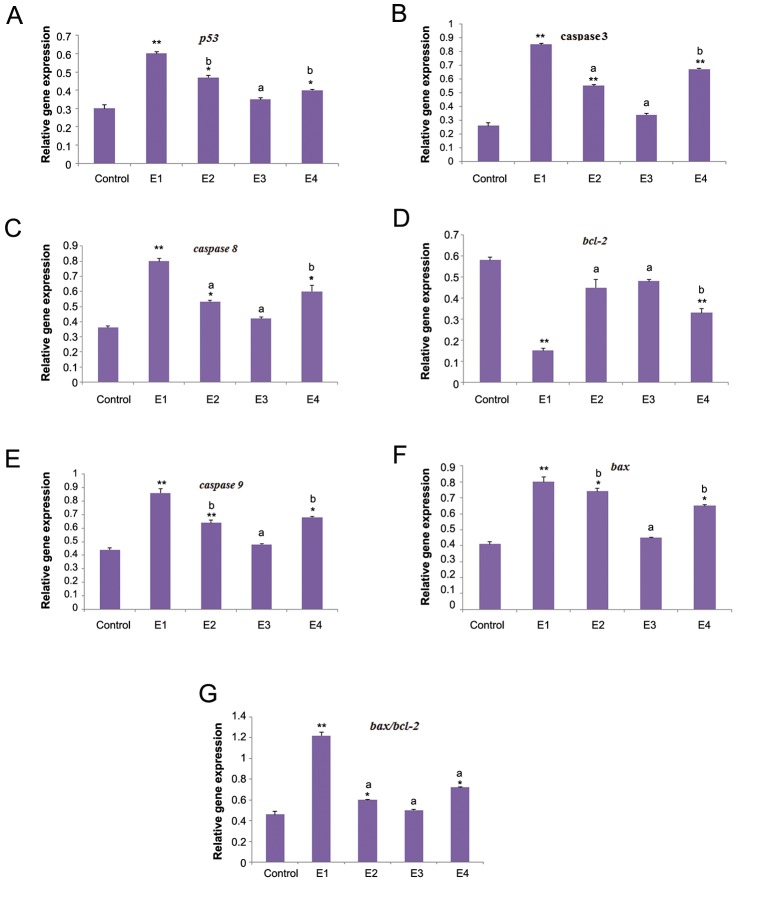
Fig.3.
Expression of related genes of apoptosis in testis of mice treated with MTX plus different concentrations of TQ using RT-PCR in 4 experimental groups (E1-E4). The differences between groups are presented by ANOVA. All the values are expressed as mean ± SEM. MTX; Methotrexate, TQ; Thymoquinone, RT-PCR; Reverse transcription polymerase chain reaction, **; P<0.001, *; P<0.01 compare to control group, a; P <0.01 and b; P<0.05 compare to MTX group.

