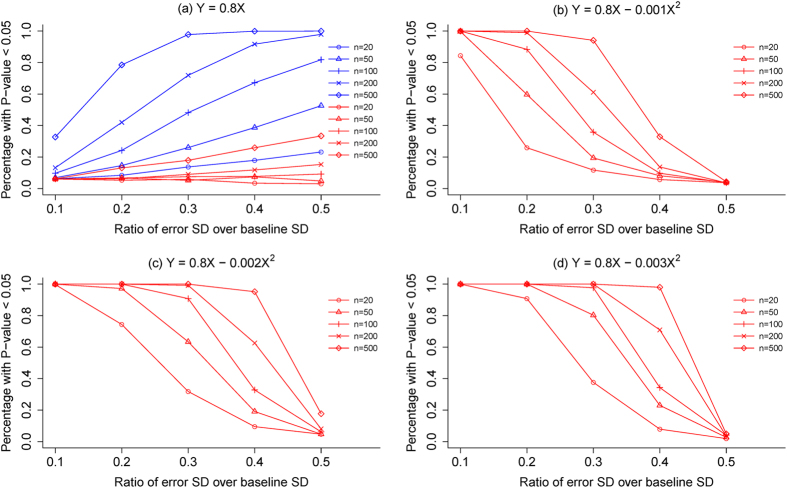
Figure 4.
Results of simulations for type-I error rates and statistical power of the proposed test under different assumptions for the ratio of standard deviation of measurement error to the standard deviation of true baseline value for samples of varying sizes: (a) the type-I errors of the proposed test (in red lines) and the usual approach to testing the relation between percentage change and baseline value, when the follow-up value Y and baseline value X is Y = 0.8X; (b) the statistical power for the proposed test when Y = 0.8X − 0.001X2; (b) the statistical power for the proposed test when Y = 0.8X − 0.002X2; (b) the statistical power for the proposed test when Y = 0.8X − 0.003X2.

