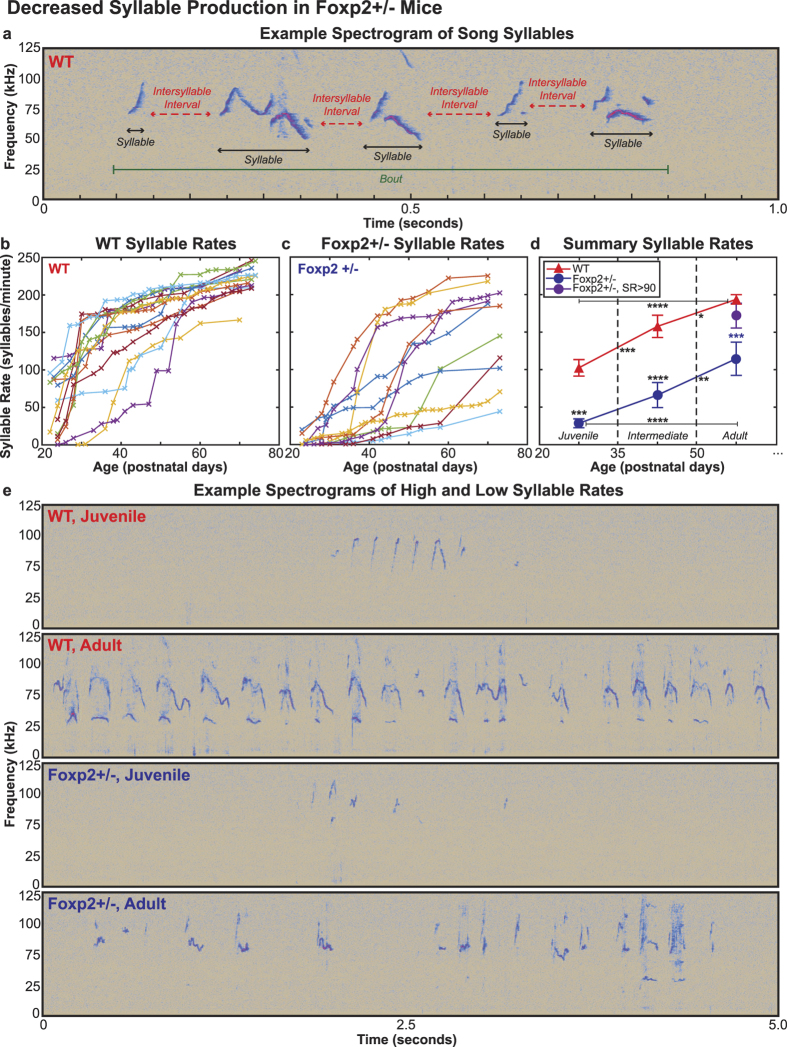
Figure 1. Decreased Syllable Production in Foxp2+/− Mice.
(a) Example spectrogram of song syllables from an adult WT animal with syllables, intersyllable intervals, and bout duration labelled. (b,c) Syllable rate (syllables per minute) in each recording session for (b) WT and (c) Foxp2+/− mice. Each line represents a different animal. (d) Mean age group syllable rate for WT (red) and Foxp2+/− (blue) mice. Data are presented as means +/− 1 standard error of the mean (SEM). All significant differences are indicated (*p < 0.05; **p < 0.005; ***p < 0.0005; ****p < 0.0001; two-way repeated measures ANOVA with Sidak’s Correction for multiple comparisons, except for comparisons between adult age groups, where ordinary one-way ANOVA with Tukey’s Correction for multiple comparisons is used). Between-genotype significant differences are indicated above the Foxp2+/− data points; blue asterisks indicate significant differences between WT adult and Foxp2+/− adult groups. All other asterisks indicate significant differences between age groups of the same genotype. Additional statistical details are presented in Supplementary Table S1. (e) Example spectrograms of song from juvenile and adult WT (top and second from top, respectively) and Foxp2+/− mice (second from bottom and bottom, respectively), demonstrating differences in syllable rate.

