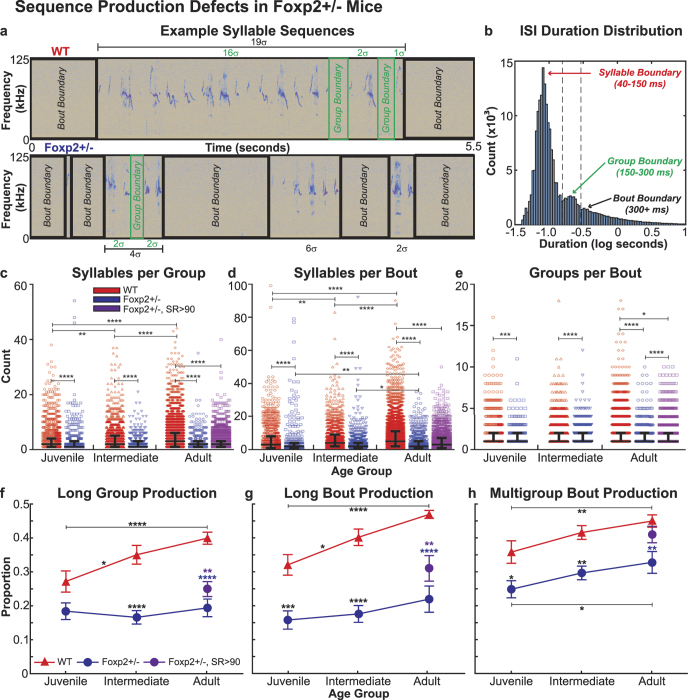
Figure 3. Sequence Production Defects in Foxp2+/− Mice.
(a) Example spectrograms of syllable sequences from adult WT (top) and Foxp2+/− (bottom) animals. Each group boundary, bout boundary, and the number of syllables in every group and bout is labelled. (b) Histogram of intersyllable interval (ISI) duration for all animals. The ISI distributions corresponding to syllable boundaries (40–150 ms), group boundaries (150–300 ms), and bout boundaries (300+ ms) are labeled. (c–e) Distributions of the number of (c) syllables per group, (d) syllables per bout, and (e) groups per bout for both genotypes at each age group, with the medians and first and third quartile values indicated. In (c–e) the number of sequencing measures contributed by individual mice has been randomly down-sampled so that each animal provides an equal proportion of data points to the respective total sample for each age group. (f–h) The average proportion of (f) long groups (>3 syllables), (g) long bouts (>5 syllables), and (h) multigroup bouts (>1 group) across animals for both genotypes at each age group. In (f) through (h), data are presented as means +/− 1 SEM. For (c) through (h), significance is reported as follows: *p < 0.05; **p < 0.005; ***p < 0.0005; ****p < 0.0001; using two-way repeated measures ANOVA with Sidak’s Correction for multiple comparisons, except for comparisons between adult age groups, where ordinary one-way ANOVA with Tukey’s Correction for multiple comparisons is used, and in (c–e) where Kruskal-Wallis tests with Dunn’s Correction for multiple comparisons are used. For (f–h), between-genotype significant differences are indicated above the Foxp2+/− data points; blue and purple asterisks indicate significant differences between WT adult and Foxp2+/− adult groups and WT adult and Foxp2+/− (SR > 90) adult groups, respectively. All other asterisks indicate significant differences between age groups of the same genotype. Additional statistical details are presented in Supplementary Tables S1 and S2.

