
Figure 1.
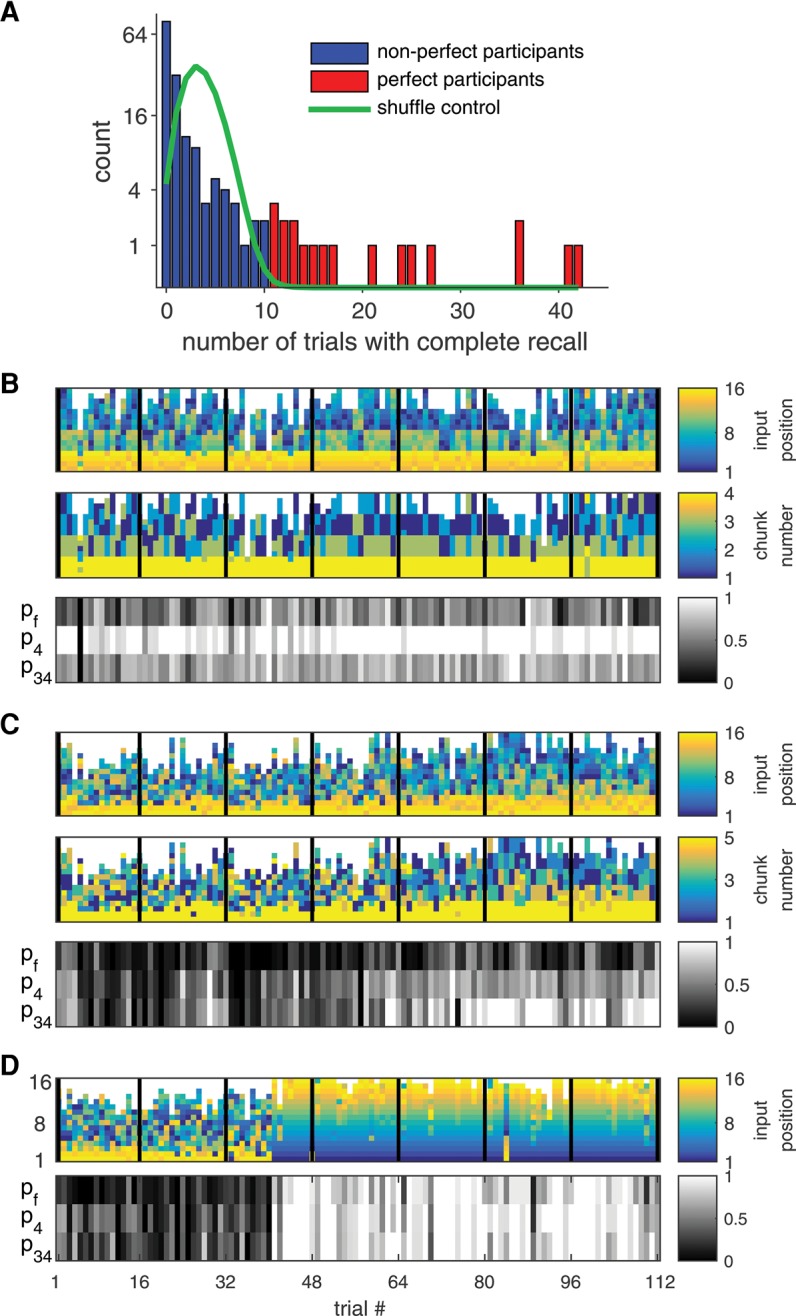
Variability of performance and positional recall strategies (A) Number of perfect trials across participants. Red, perfect participants; blue, nonperfect participants; green, bootstrap distribution. (B) All 112 trials of a selected participant. (Upper panel) recalled words are shown from bottom to top in the order of their recall, and their color corresponds to their input order in the presented list, from blue to yellow. The number of words recalled at each trial is given by the number of colored squares in the corresponding vertical column. Black vertical lines denote the end of each daily session. (Middle panel) same data but colors represent the chunk number of a word according to its position on the presented list, for 4444 grouping (chunks 1–4: words 1–4, 5–8, 9–12, 13–16, correspondingly). (Lower panel) probability measures for three strategies, computed for each trial of this participant using maximum likelihood. The rows denoted by pf, p4, p34 correspond to forward, 4444, and 33334 chunking strategy, respectively (see text and Materials and Methods). (C) Same as B for another participant, (chunks 1–5: words 1–3, 4–6, 7–9, 10–12, 13–16, correspondingly). (D) Another participant, who abruptly develops a forward chaining strategy after the 41st trial.