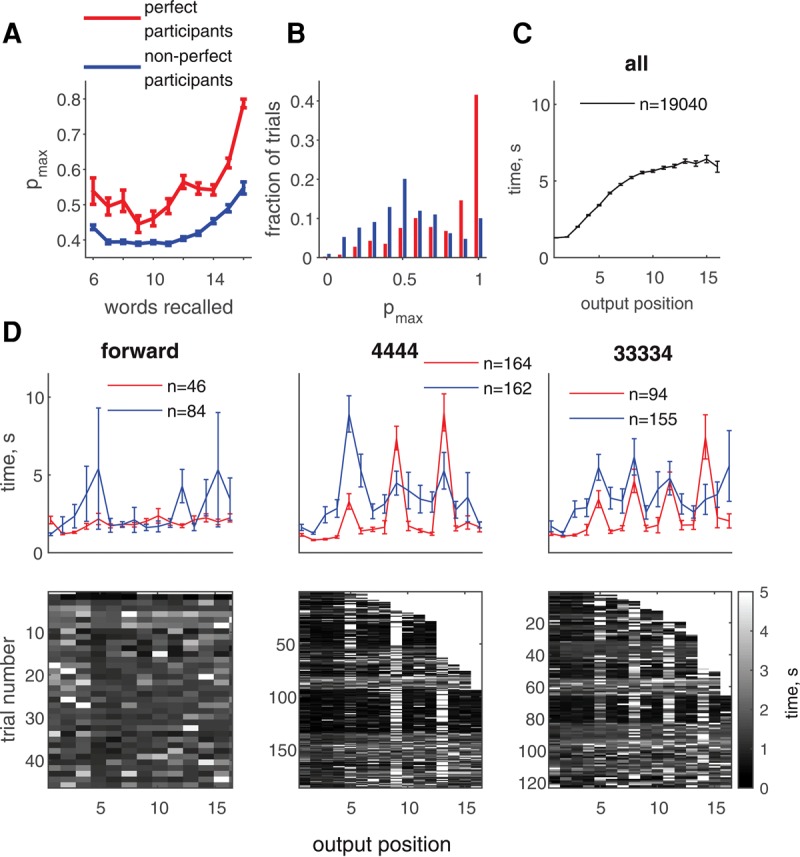
Figure 2.

Perfect trials and perfect participants. (A) Average pmax values for trials with different numbers of words recalled. Red, perfect participants; blue, nonperfect participants. Error bars: SEM. (B) Histogram of pmax over the perfect trials, for perfect participants (red) and the rest (blue). (C) Average recall times for subsequently recalled words across all trials. (D) (Top row) Average recall times for subsequently recalled words for specific strategy, separately for perfect participants and the rest (only trials with pmax = 1 are used, strategy indicated in the title; see Materials and Methods). Red: perfect participants, blue: the rest. The numbers in the legends show the number of trials used to compute average recall times. (Bottom row) color-coded recall times in the individual trials for perfect participants (trials are sorted according the number of recalled words).
