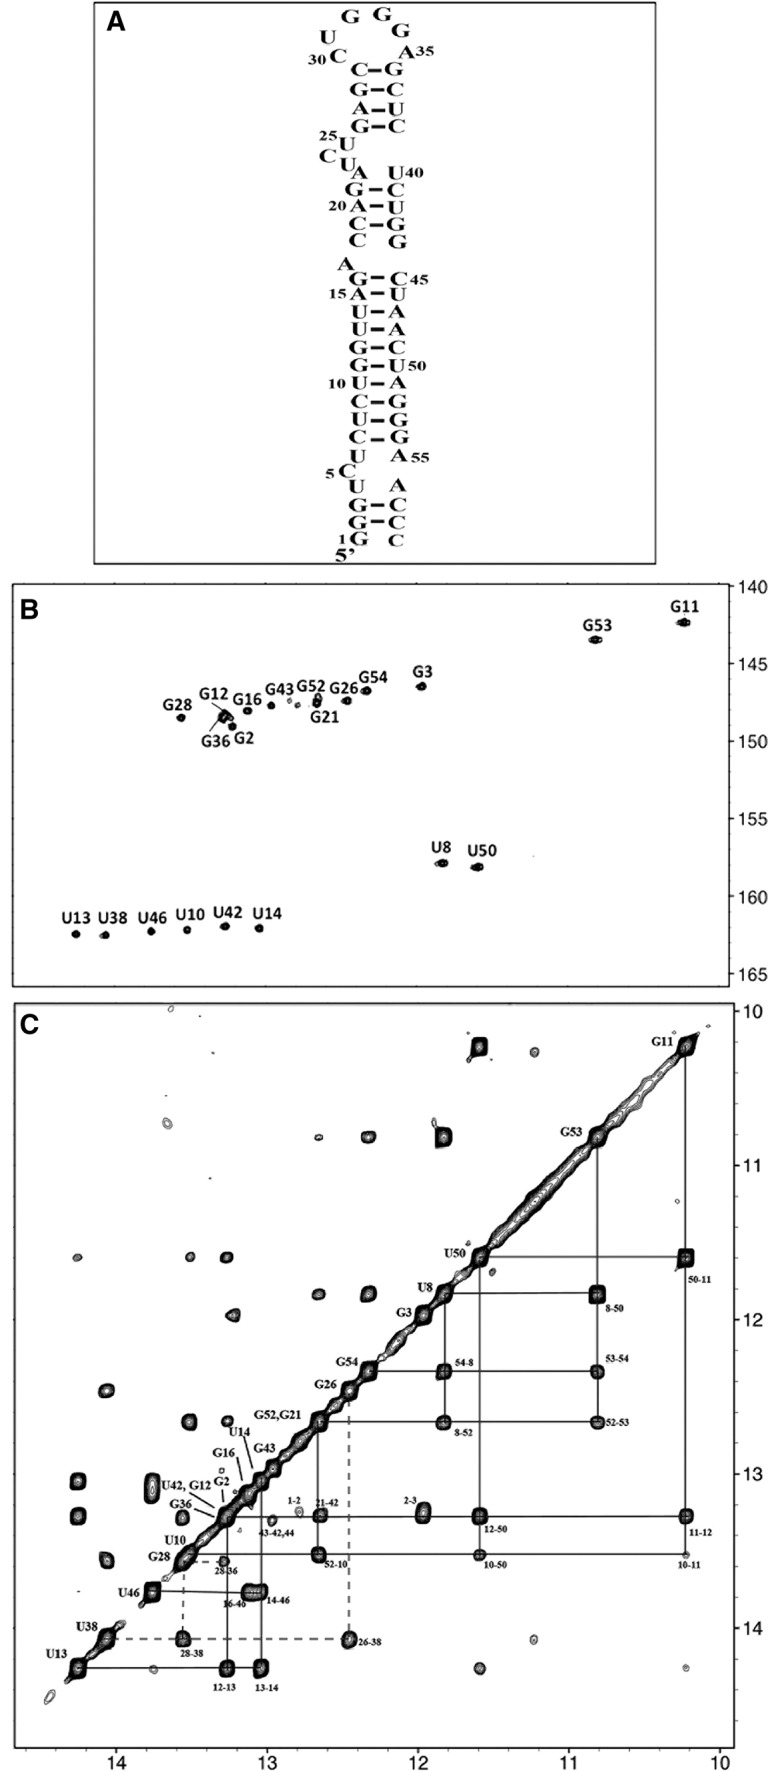
FIGURE 1.

Schematic diagram of TAR with the detected imino protons indicated, together with the associated NMR spectra. (A) Diagram of the TAR molecule with black marks indicating the base pairs for which imino protons were successfully detected and assigned in NMR experiments. The observation of G44 was ambiguous, and therefore no black mark was assigned to this base pair. (B) 1H–15N TROSY spectrum of the imino groups of labeled 15N,13C-labeled TAR at 10°C and 950 MHz. The peaks are labeled with the name of the residue bearing the imino proton. (C) The imino group part of the 2D NOESY spectrum of 15N,13C-labeled TAR at 10°C and 950 MHz. Imino protons are labeled with the name of the residue bearing this proton. The NOE connectivities involving the different parts of TAR are indicated with lines of different types: solid lines for NOE connectivities in the long stem (base pairs C7–G54 to G16–C45); dotted lines for the upper stem (base pairs G26–C39 to C29–G36). The connectivities of the intermediate stem (base pairs C18–G44 to G21–C39) are not indicated by lines, because some ambiguity remains for the detection of G44 (with U42) near 13.25 ppm (spectral overlap). A corresponding cross-peak labeled “43–42,44” indicates the possible cross-peak within this stem. Note that the distance corresponding to the separation of G23 and U42 imino protons would be expected to exceed 5 Å in a standard A-RNA helix.
