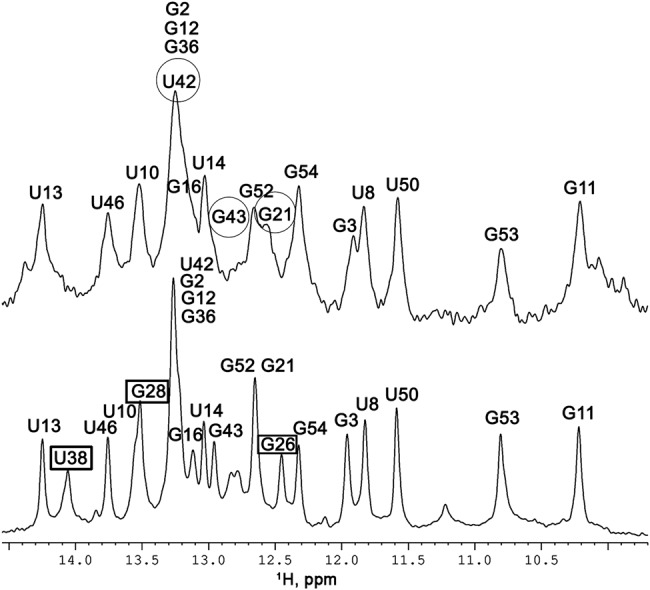
FIGURE 3.

Imino proton region of 15N labeled TAR at 10°C. (Bottom) Free TAR, (top) TAR with NC in a 1:1 ratio (1:59 NC:nt). The resonances that disappear totally are indicated by rectangles in spectrum at the bottom; the resonances showing significant broadening and/or chemical shifts are indicated by circles in the top spectrum.
