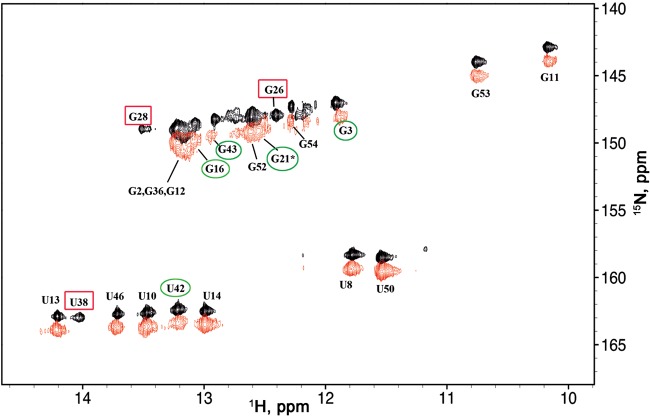
FIGURE 4.
2D 1H–15N SOFAST-HMQC spectra at 10°C and 950 MHz of free TAR (black) and TAR-NC in a 1:1 ratio (1:59 NC:nt) (red) at 10°C and 950 MHz. The imino groups are labeled with the name of the residue. The resonances that disappear totally are indicated by red rectangles and those that display significant broadening and/or chemical shifts are indicated by green circles. The two spectra have been shifted to facilitate visualization of the sets of resonances.

