
FIGURE 3.
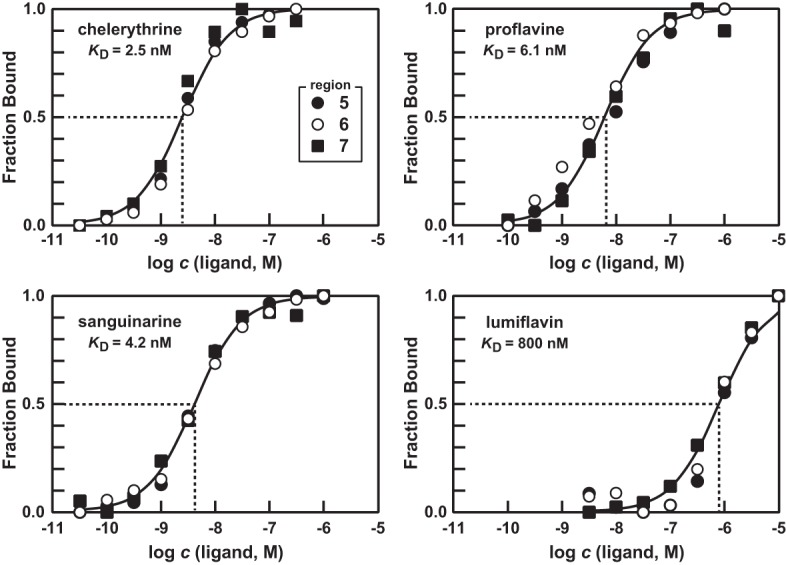
Binding curves for several azaaromatic ligands of yjdF RNA. Plots depict the estimated fraction of 108 yjdF RNAs bound to ligand versus the logarithm of the concentration (c) of ligand in molar units. Fraction bound values were estimated based on the extent of band intensity changes at regions 5, 6, and 7 as depicted in Figure 1B.