FIGURE 4.
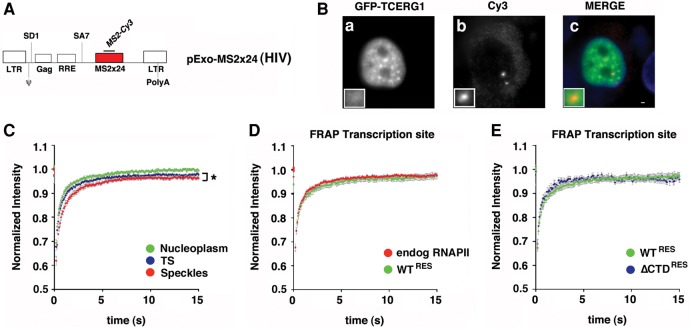
Dynamics of TCERG1 at the HIV-1 TS in the Exo1 cells. (A) Schematic representation of the HIV-1 reporter (pExo-MS2 × 24, HIV) stably integrated into U2OS cells (Exo1 cells). The reporter contains the two HIV-1 LTR sequences, the packaging sequence (ψ), the splice donor (SD1), the Rev-responsive element (RRE), the splice acceptor (SA7), and 24 MS2-binding sites in the 3′untranslated regions for detection in live and fixed cells. (B) Exo1 cells were transfected with GFP-TCERG1 and Tat expression vectors and processed for fluorescence in situ hybridization. GFP-TCERG1 was visualized using immunofluorescence (a), and HIV-1 RNAs were detected using probes against the MS2 repeats (b). Merge images present GFP-TCERG1 in green and RNAs in red (c). Scale bar, 3 µm. (C) Fluorescence recovery of GFP-TCERG1 was measured in the nucleoplasm (green; n = 34), nuclear speckles (red; n = 34), and HIV-1 TS (blue; n = 32) of Exo1 cells cotransfected with GFP-TCERG1, Tat and MS2-mcherry expression plasmids. The curves correspond to a pool of at least three independent experiments, and the error bars represent the SEM. (D) FRAP of Exo1 cells transfected with GFP-TCERG1, Tat, MS2-mcherry, and the α-amanitin-resistant wild-type (WTRES) RNAPII expression plasmids. Cells were treated with 0.1 µg/µL α-amanitin for 2 h before FRAP analysis. Fluorescence was measured at the HIV-1 TS (green; n = 21). The same analysis was also performed for the endogenous polymerase (red; n = 32). (E) The same experiment described for panel D was performed with the α-amanitin-resistant wild-type (green; n = 21) and ΔCTD (ΔCTDRES) (blue; n = 11) polymerases. In both panels, the curves represent at least two independent experiments, and the error bars indicate the SEM. (*) P < 0.05.

