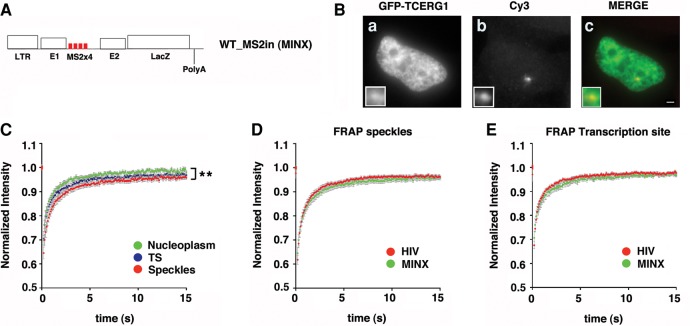
FIGURE 5.
Analysis of GFP-TCERG1 dynamic properties in the WT_MS2in cells. (A) Schematic representation of the MINX reporter containing 4 MS2-binding sites within the MINX intron (WT_MS2in). The reporter contains the HIV-1 LTR, the LacZ gene, and the cleavage and polyadenylation sequence of the bovine growth hormone gene (bGH). (B) WT_MS2in cells were transfected with the GFP-TCERG1 and Tat expression vectors. TCERG1 was visualized using immunofluorescence (a) and RNAs were visualized by FISH with probes against the MS2 repeats (b) 24 h after transfection. Merge images present GFP-TCERG1 in green and RNAs in red (c). Scale bar, 3 µm. (C) FRAP of WT_MS2in cells transfected with the GFP-TCERG1, Tat, and MS2-mcherry expression plasmids. Fluorescence was measured in the nucleoplasm (green; n = 16), at the HIV-1 TS (blue; n = 14), and in the nuclear speckles (red; n = 16). The curves represent a pool of at least three independent experiments, and the error bars indicate the SEM. (D,E) FRAP curves for GFP-TCERG1 at the speckles (D) and TS (E) of the Exo1 (HIV) (red; n = 32) and the WT_MS2in (MINX) (green; n = 14) cells are presented. The curves represent at least two independent experiments, and the error bars indicate the SEM. (**) P < 0.01.

