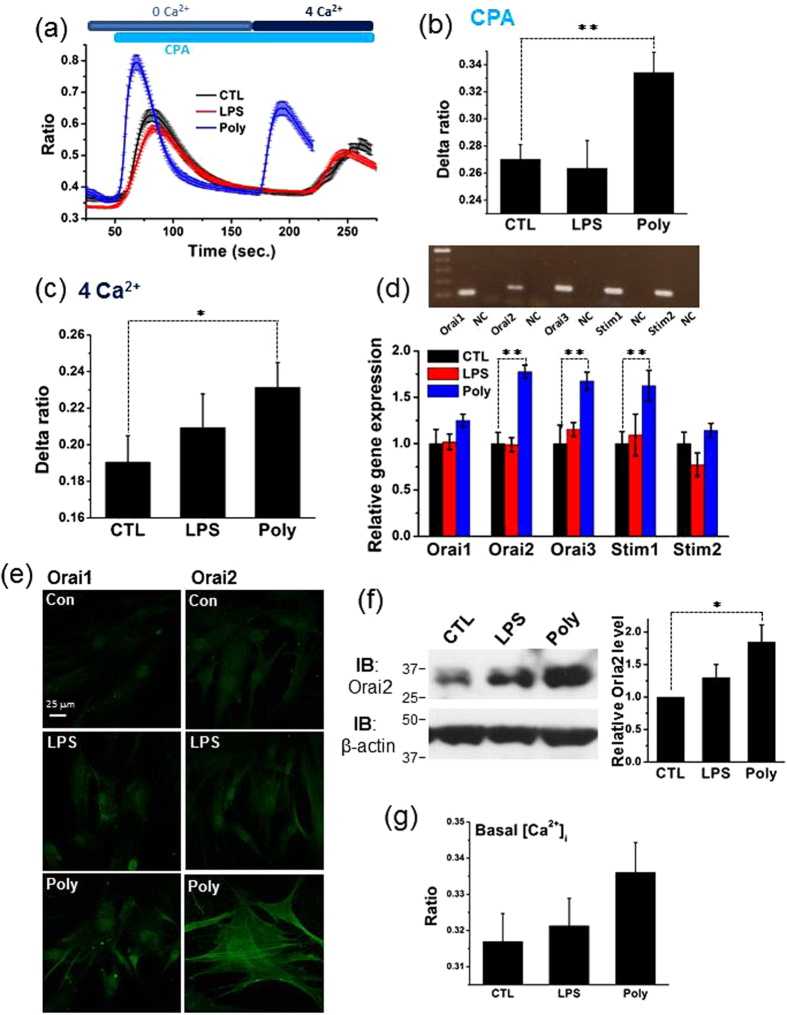
Figure 5. Incubation with Poly(I:C) rather than LPS augments Orai and STIM expression and SOCE in hMSCs.
(a) Averaged [Ca2+]i traces showing [Ca2+]i transients induced by stimulation with CPA (first) and those evoked by addition of extracellular Ca2+ (second) in control (n = 40 cells), LPS- (n = 79 cells) and poly(I:C)-treated cells (n = 30 cells) immersed in Ca2+-free extracellular solution. (b) Summarized graph illustrating the mean net increases in [Ca2+]i reflected by the averaged delta F340/F380 ratios recorded in control, LPS- or poly(I:C)-treated groups. Experiments were performed sixteen times. (c) Summarized graph showing the mean net increases in [Ca2+]i reflected by the averaged delta F340/F380 ratios following extracellular application of 4 mM Ca2+ in control, LPS- or poly(I:C)-treated cells with intracellular Ca2+ stores pre-emptied by CPA. Experiments were performed sixteen times. (d) Representative RT-PCR blots (upper panel) illustrating the mRNA expression levels of three Orai subtypes and two STIM subtypes in control cells. NC represents the negative control with distilled water. Real-time RT-PCR quantification (lower panel) showing different mRNA expression profiles of three Orai subtypes (Orai1, Orai2 and Orai3) and two STIM subtypes (Stim1 and Stim2) in the control (n = 3), LPS (n = 3) and poly(I:C) (n = 3) groups. (e) Confocal images illustrating the different intensities of Orai1 and Orai2 immunofluorescence in control cells (upper panel) and cells exposed to LPS (middle panel) or poly(I:C) (lower panel). (f) Representative western blot of Orai2 in control cells and cells exposed to LPS or poly(I:C) (left panel). Summarized graph showing the normalized level of Orai2 in the indicated conditions. β-actin was used as a loading control. Experiments were performed four times (right panel). (g) Summarized graphs showing basal [Ca2+]i reflected by the averaged F340/F380 ratios registered before application of CPA in control cells and cells exposed to LPS or poly(I:C). Experiments were performed nineteen times. The significance level was set at *p < 0.05 or **p < 0.005.

