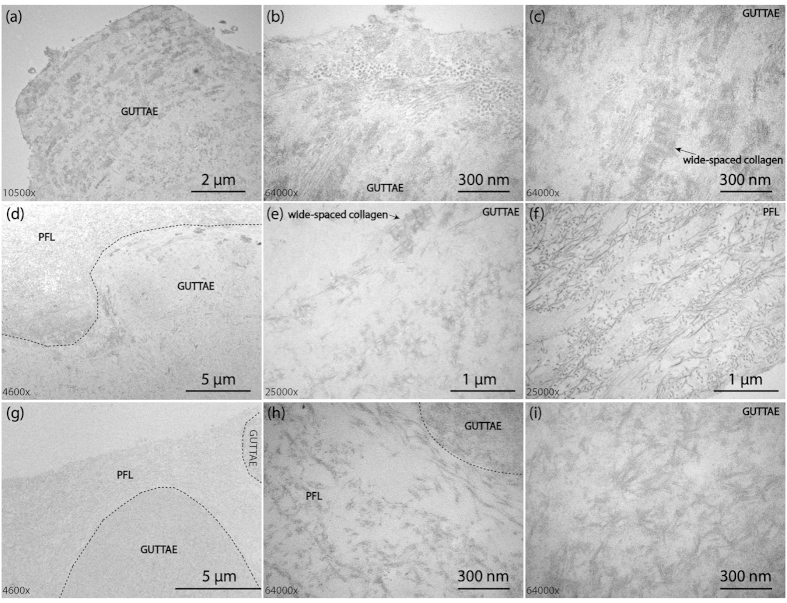
Figure 2. TEM images of three types FECD-DMs obtained from corneal transplant surgery.
(a–c) Type I FECD-DM; (a) Low magnification image; High magnification image of guttae (b) at the edge and (c) at the center; (d–f) Type II FECD-DM with an additional PFL; (d) The image on the boundary between PFL and guttae; (e) The zoom in image on the guttae; (f) The zoom in image on the PFL layer; (g–i) Type III FECD-DM with two layers of guttae; (g) The two layers of guttae separated with each other by the PFL layer; (h) The image of porous PFL near the guttae; (i) The image on the guttae. The black dash lines in (d), (g,h) indicate the boundary.

